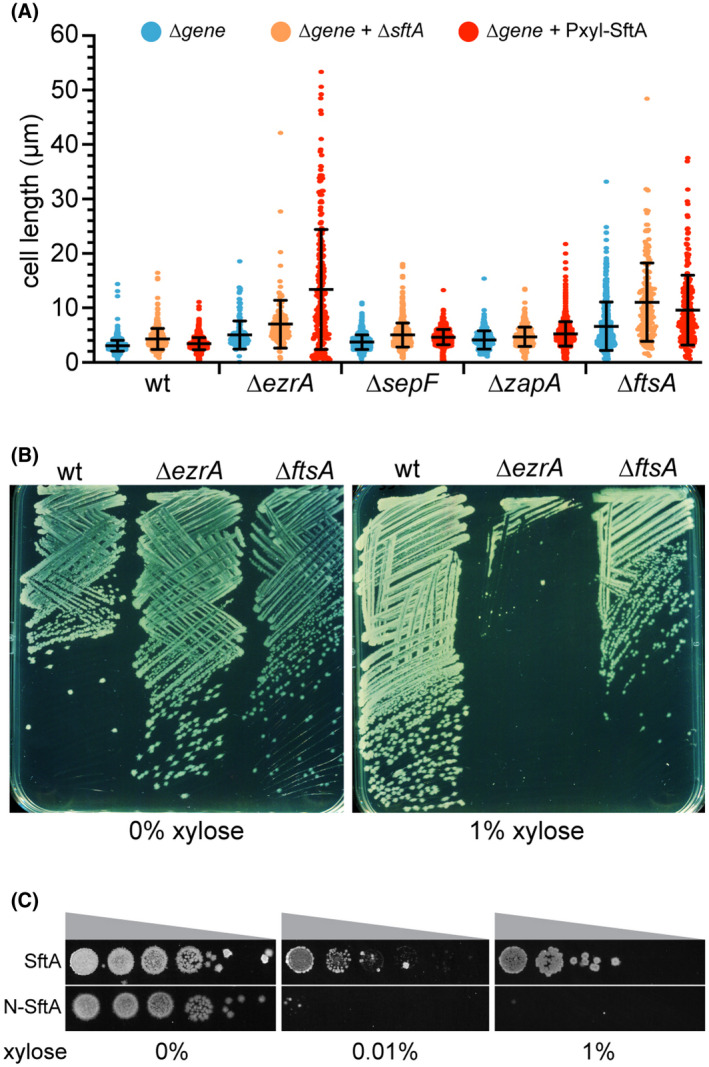
FIGURE 6.

SftA overexpression influences cell division of an ezrA mutant. (a) Scatter plot showing cell lengths of different cell division mutants (blue), combined with either a sftA deletion (orange) or after overexpression of SftA (red). SftA overexpression was achieved by induction with 1% xylose for 1 h. On average 300 cells were analyzed. Means and standard deviations are indicated. (b) Overexpression of SftA in a ∆ezrA mutant affects its viability on the plate. The ∆ezrA and ∆ftsA backgrounds contain an extra xylose‐inducible sftA copy. (c) Dilution spot assay showing the effect on the viability of a ∆ezrA mutant when either full‐length SftA (SftA) or the N‐terminal 149 amino acids (N‐SftA) is induced with increasing xylose concentrations. Strains used in (a): wild type (wt), TNVS083, TNVS390, TNVS158, TNVS171, TNVS591, TNVS159, TNVS152 TNVS605, TNVS193, TNVS197, TNVS606, TNVS281, TNVS869, TNVS622, respectively. Strains used in (b): TNVS390, TNVS591, and TNVS622, respectively. Strains used in (c): TNVS591 and TNVS602, respectively
