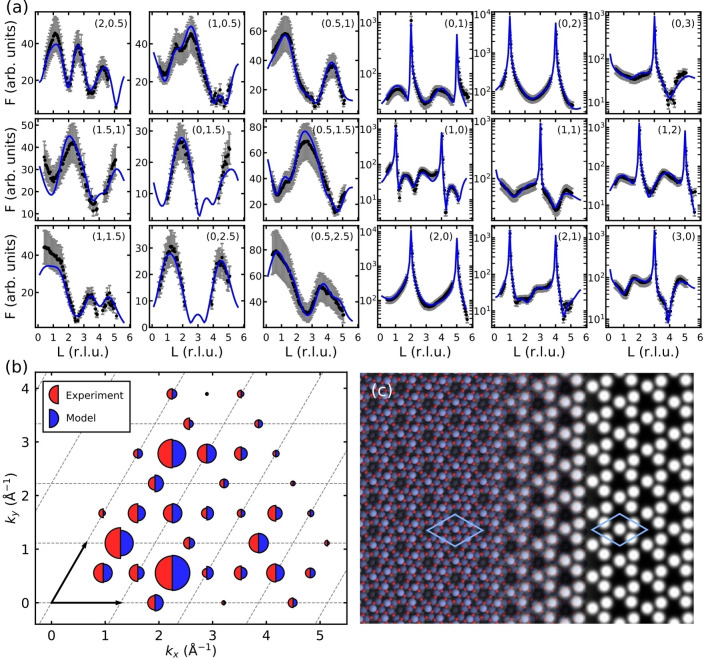
Figure 4.
a) Measured (black) and fitted (blue) X‐ray diffraction rod profiles for the (4×4) phase. b) Reciprocal space map showing the measured and calculated in‐plane X‐ray structure factors for the (4×4) phase. Dashed lines and arrows indicate the (2×2) unit cell of the ordered alloy surface used as a reference. c) Simulated AFM frequency‐shift image of the Sn11O12 structure, based on DFT calculations. [39]

