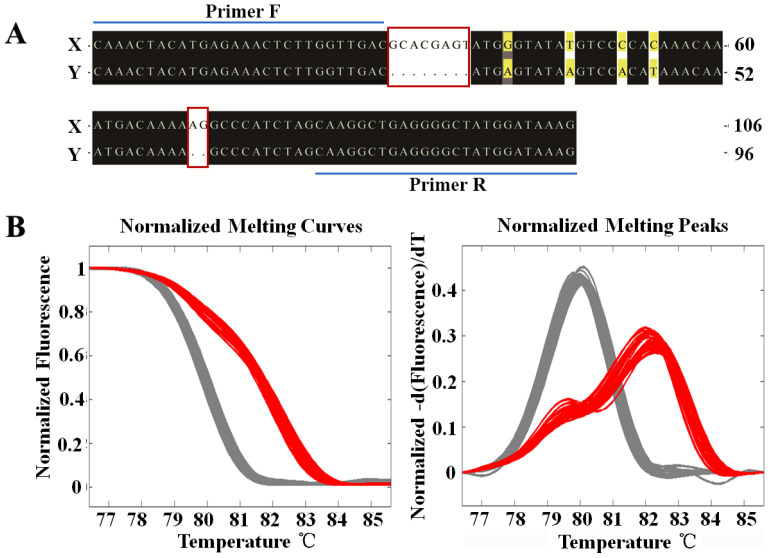
Figure 2.
Screening and validation of a sex-specific marker. (A) Sequence differences of a sex-specific marker in S. chuatsi. Indels are marked with the red boxes; SNPs are marked with a yellow background. The line area indicates the location of upstream and downstream primers. (B) The HRM method was used to classify wild females (n = 38) and males (n = 31). The left and right figures show the normalized melting curves and normalized melting peaks of amplified PCR products, respectively. The gray curve represents females, while the red curve represents males.

