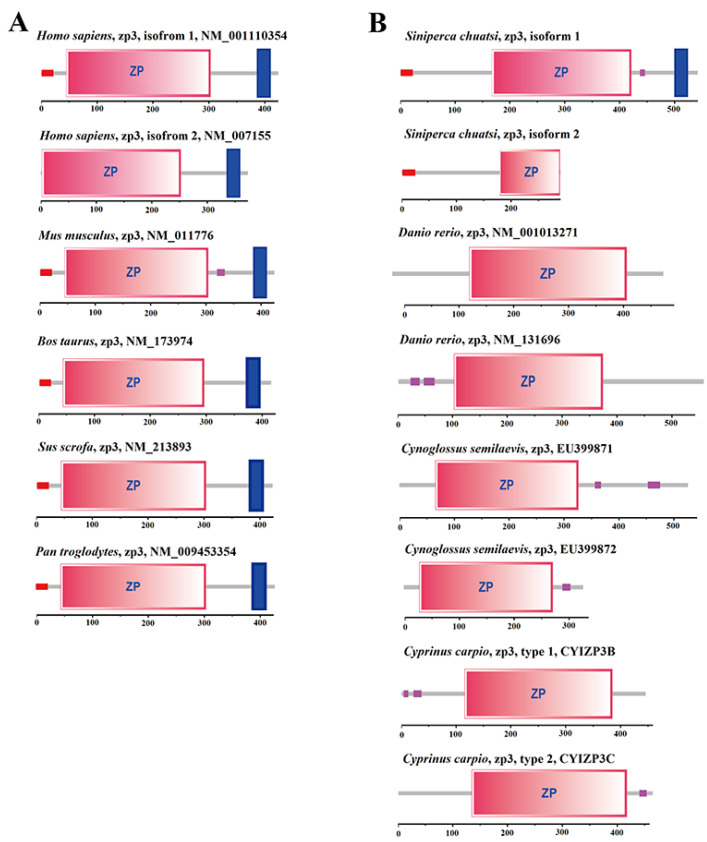
Figure 5.
Domain difference analysis of two isomers of the LG24G003870 gene. (A) ZP3 protein domains in mammals. (B) ZP3 protein domains in fish. The red boxes represent the signal peptide sequence; the pink boxes represent the ZP domain; the blue boxes represent the transmembrane region; the pink and purple boxes represent the low-complexity region.

