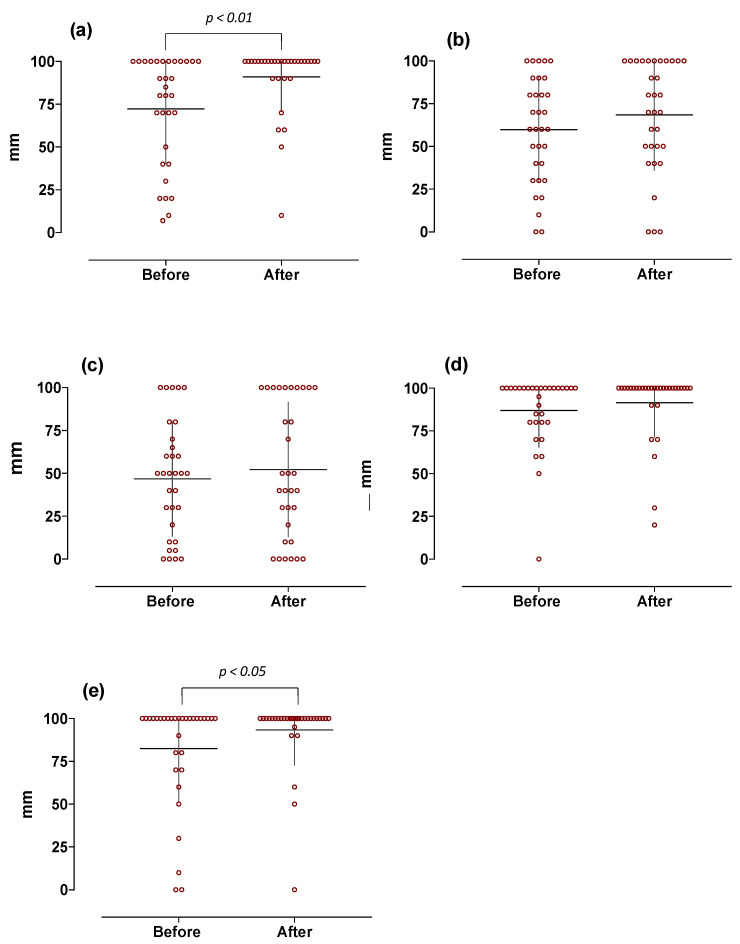
Figure 4.
Basic taste-induced intensity in obese subjects at baseline and 1 year after the sleeve gastrectomy (n = 32). Graphs are relative to individual scores with superimposed mean ± SD. Data are expressed as mm as measured on 100 mm VAS scale (0 = absent and 100 = maximum perceived intensity). The different panels, respectively, indicate: (a) sour-, (b) salty-, (c) umami-, (d) sweet-, and (e) bitter-induced responses.

