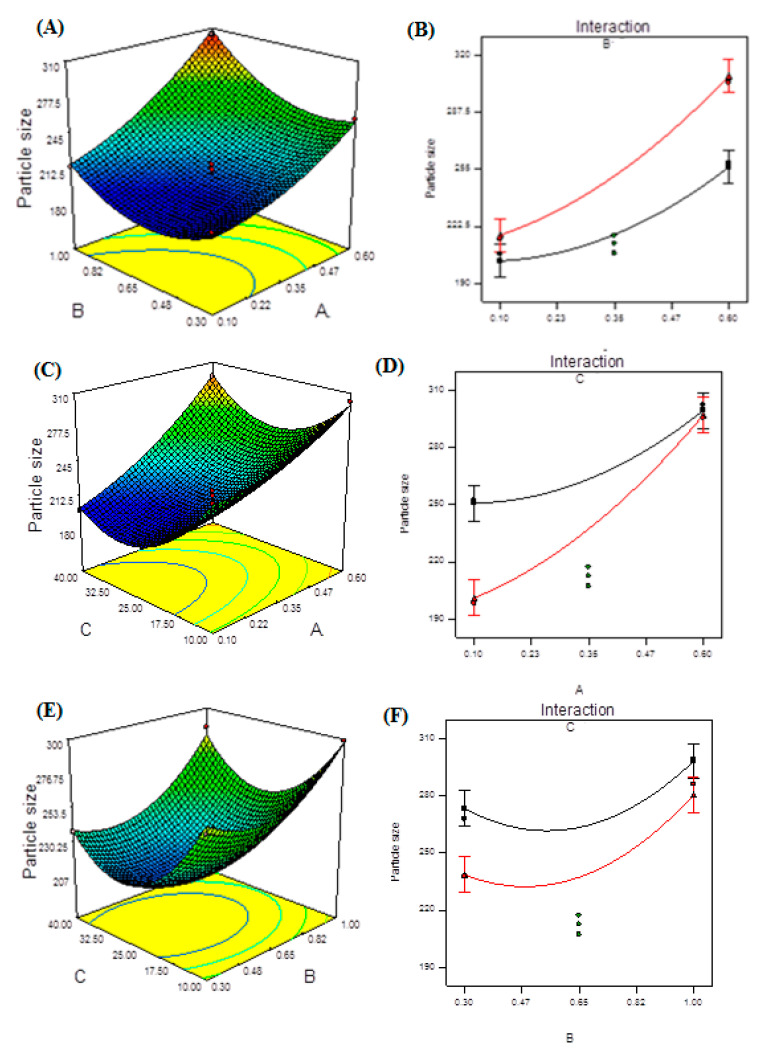
Figure 3.
Model graphs: particle size. (A) Three-dimensional response surface plots showing the effect of variables (A: TPP concentration and B: CS concentration) on response (particle size), (B) interaction plot, (C) 3D response surface plots showing the effect of variables (A: TPP concentration and C: ultrasonication energy) on response (particle size), (D) interaction plot, (E) 3D response surface plots showing the effect of variables (B: CS concentration and C: ultrasonication energy) on response (particle size) and (F) interaction plot.

