
FIGURE 2.
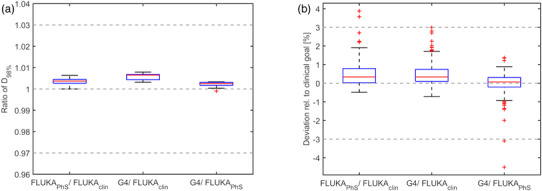
Influence of the particle spectra on DVH parameters of all patient cases represented with boxplots. The ratio of the D98% parameters of the PTV is shown in the left panel. The difference of all 199 evaluated DVH parameters of the OARs is shown on the right relative to the clinical goal. The red line in the box represents the median, the upper, and lower edges of the box the 25th and 75th percentiles; the whiskers the most maximum and minimum (following Tukey definition) excluding outliers which are represented with red + symbols