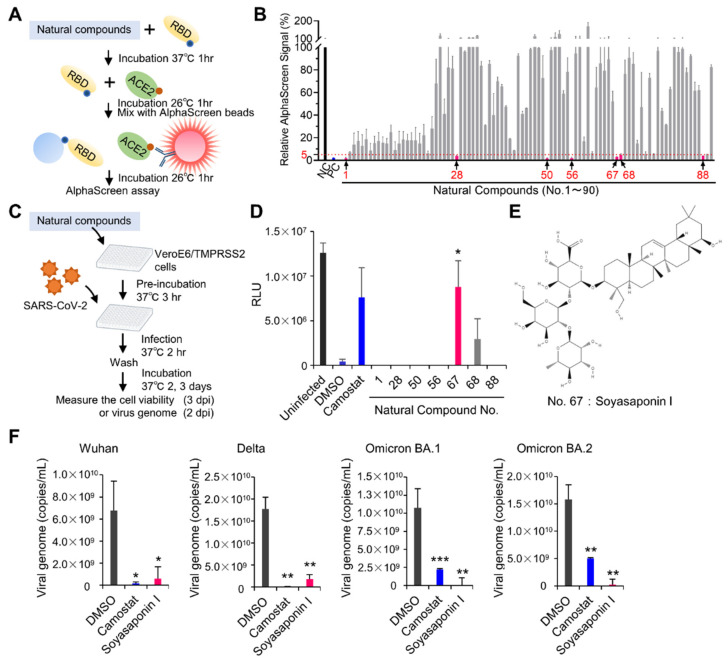
Figure 4.
Application for drug screening using AlphaScreen assay to evaluate RBD–ACE2 interaction. (A) Schematic representation of drug screening using AlphaScreen assay. Ninety natural compounds were used for drug screening to inhibit RBD–ACE2 interaction in vitro. (B) AlphaScreen assay for drug screening. The relative AlphaScreen signal was calculated with DMSO as 100%. DTT was used as positive control (PC). Seven compounds with signals decreased to 5% or less were used for further screening. (C) Schematic diagram of infection assay to assess the antiviral effect of selected seven compounds. Antiviral activity of drug at a concentration of 100 µM was evaluated using cell viability as an indicator after virus infection. dpi, days post-infection. (D) Result of infection assay. Here, 25 µM of Camostat was used as a positive control. (E) Structure of drug No. 67: Soyasaponin I (PubChem Identifier: CID 122097). (F) Inhibitory activity of Soyasaponin I at a concentration of 100 µM against different SARS-CoV-2 strains in infection assay. All graph data are presented as mean ± SD, Welch‘s t test (two-tailed), * p < 0.05, ** p < 0.01, *** p < 0.001.

