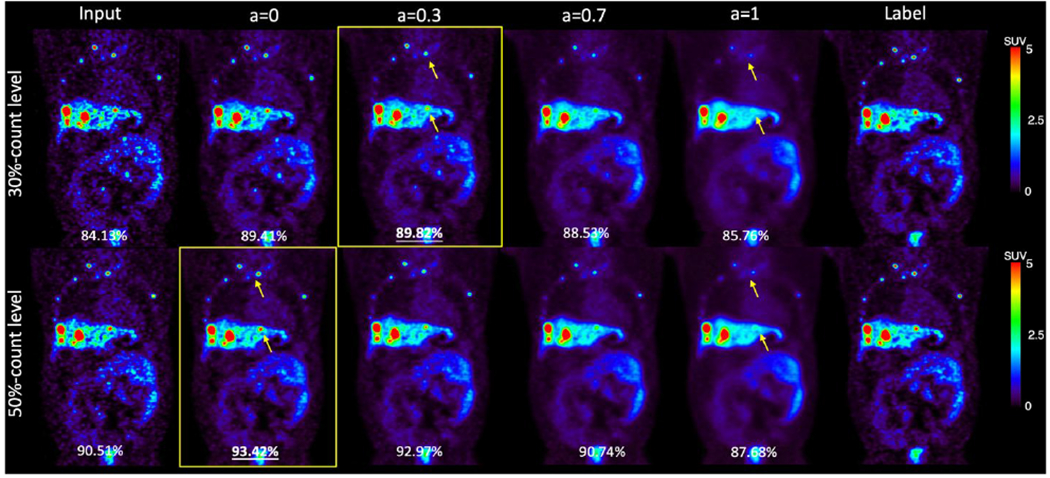
Figure 13.

Samples of 30%-count and 50%-count DOTATATE images, and denoised images at weights 0, 0.3, 0.7, and 1. The SSIM value are shown in the bottom of each image. Weighted denoised images with the highest SSIM are framed. The yellow arrows point out lesions that were smoothed by U-Net 20.
