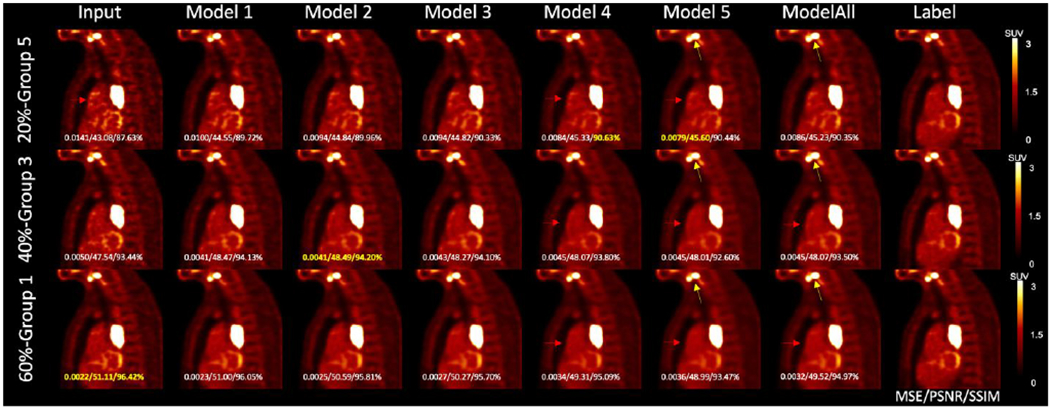
Figure 6.

Results of matched denoising, unmatched denoising, and one-size-fits-all denoising from one sample patient. The MSE, PSNR, and SSIM values with the label image as reference are shown on each image, with the highest value shown in yellow. Yellow arrows point to the gap between two lesions. Red arrows indicate the noise reduction in the chest.
