Figure 9.

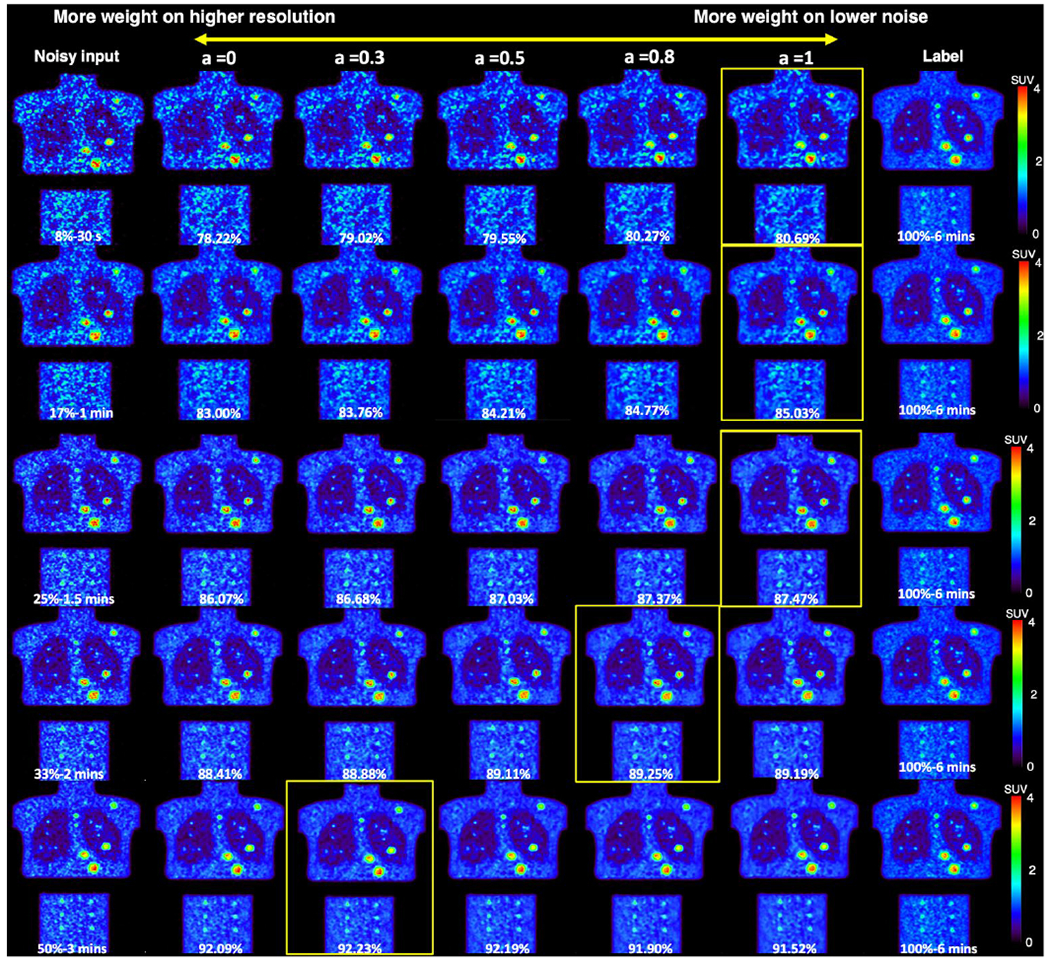
Personalized denoising results for phantom images at 8%, 17%, 25%, 33%, and 50% counts level. The weighting factor is denoted as ‘a’. The SSIM values are shown on the image in yellow. Denoised images with the highest SSIM value are framed.

Personalized denoising results for phantom images at 8%, 17%, 25%, 33%, and 50% counts level. The weighting factor is denoted as ‘a’. The SSIM values are shown on the image in yellow. Denoised images with the highest SSIM value are framed.