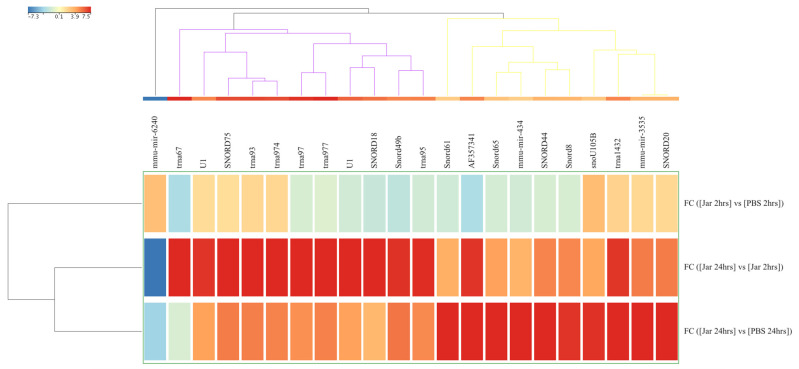
Figure 2.
Differences in known small RNA (sRNA, n = 22) expression levels from gastrocnemius muscle samples obtained after 2 hrs and 24 hrs of challenge with jararhagin and PBS. The sample-clustering tree is displayed to the left and the sRNA clustering tree is above forming 3 clusters as indicated by black, purple, and yellow colors. The color scale at the top indicates the relative expression levels of sRNA across all samples. Red indicates a high expression level and blue indicates a low expression level. Each column represents one known sRNA, and each row represents one sample.

