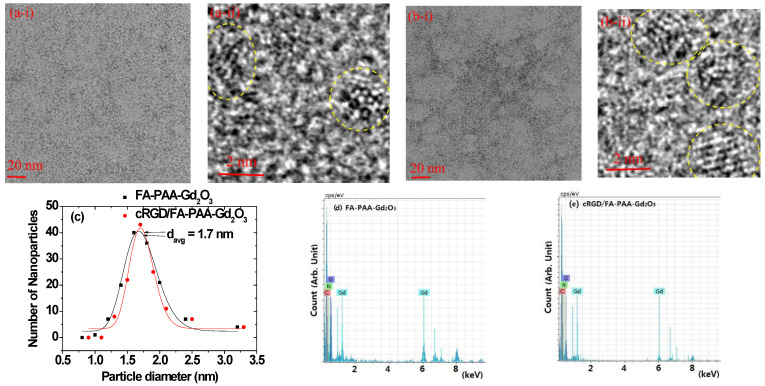
Figure 2.
TEM images of (a-i,a-ii) FA-PAA-Gd2O3 and (b-i,b-ii) cRGD/FA-PAA-Gd2O3 nanoparticles at 20 and 2 nm scales. The yellow circles indicate individual nanoparticles. (c) Log-normal function fit of the observed particle diameter distributions to estimate davg values. EDS spectra of (d) FA-PAA-Gd2O3 and (e) cRGD/FA-PAA-Gd2O3 nanoparticles to confirm presence of C, O, N, and Gd in the nanoparticles.

