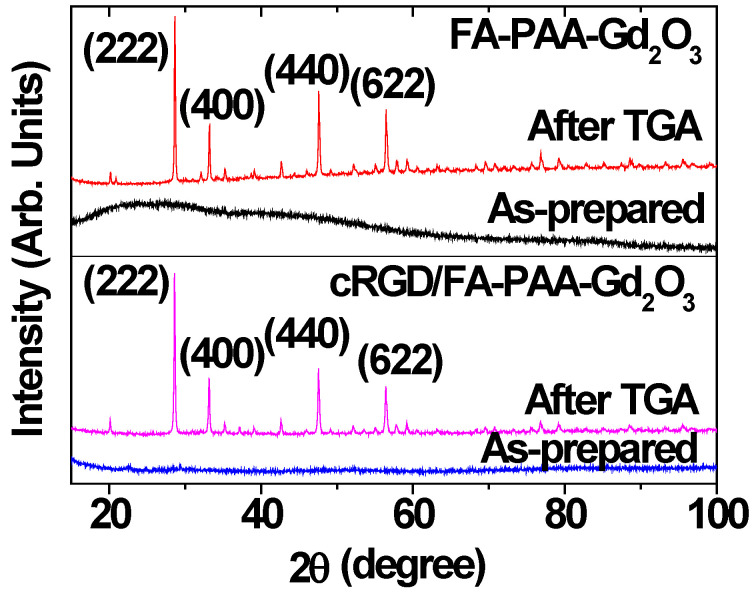
Figure 4.
XRD patterns of the FA-PAA-Gd2O3 and cRGD/FA-PAA-Gd2O3 nanoparticles before (i.e., as-prepared) and after TGA. The representative assignments on XRD peaks after TGA are the (hkl) Miller indices of cubic Gd2O3. All observed peaks could be assigned with the (hkl) Miller indices of cubic Gd2O3.

