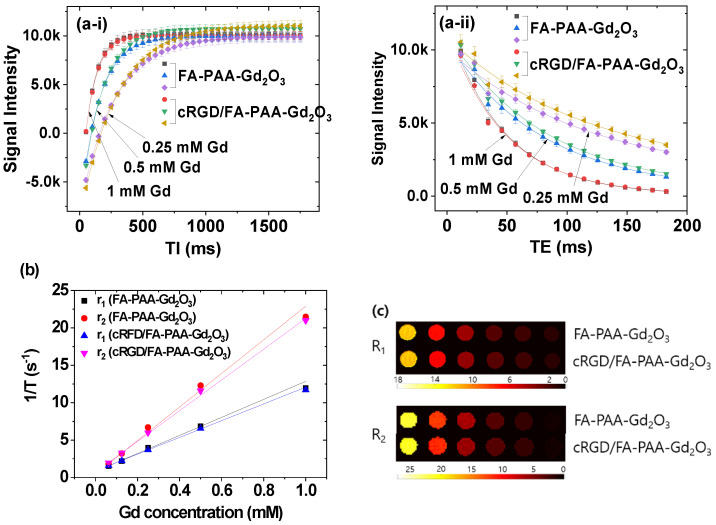
Figure 6.
Nonlinear least-square fits to (a-i) the measured mean signal intensities at various TI values to obtain T1 relaxation times and (a-ii) the mean signal intensities of multiple spin-echo measurements at various TE values to obtain T2 relaxation times. (b) Plots of 1/T1 and 1/T2 inverse relaxation times as a function of Gd concentration for FA-PAA-Gd2O3 and cRGD/FA-PAA-Gd2O3 nanoparticles in aqueous media at H = 3.0 T and 22 °C. The slopes correspond to r1 and r2 values, respectively. (c) R1 and R2 map images showing dose-dependent contrast enhancements.

