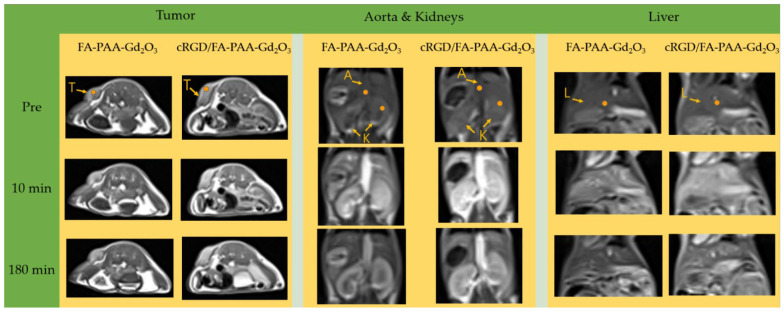
Figure 8.
T1 MR images at a 3.0 T MR field as a function of time before (labeled as “Pre”) and after intravenous injection of aqueous FA-PAA-Gd2O3 and cRGD/FA-PAA-Gd2O3 nanoparticle suspension samples into mice tails. “T” denotes the tumor, “A” denotes the aorta, “K” denotes the kidneys, and “L” denotes the liver. The regions of interest (ROIs) are labeled with small dots.

