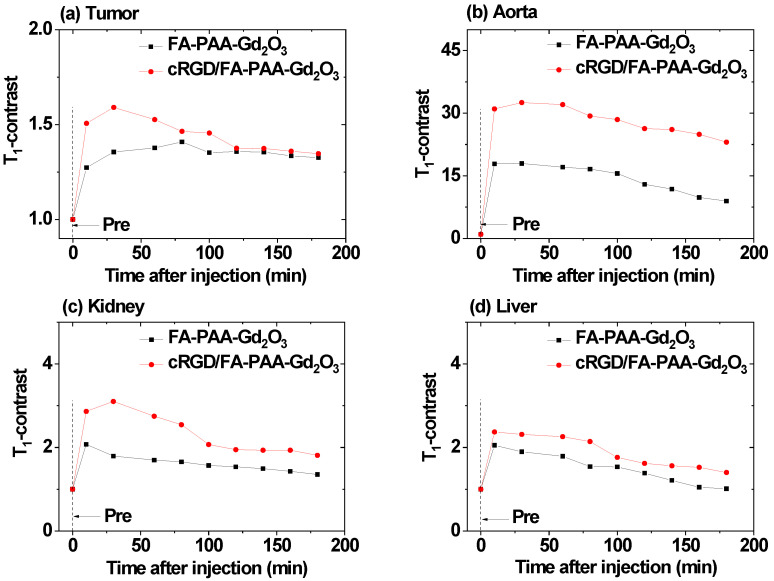
Figure 9.
Plots and comparison of T1-contrast ROIs between the FA-PAA-Gd2O3 and cRGD/FA-PAA-Gd2O3 nanoparticles in (a) the tumor, (b) aorta, (c) kidneys, and (d) liver as a function of time before and after intravenous injection of the nanoparticle suspension samples into mice tails. T1-contrast ROI = SNR (t)/SNR (0).

