

Abstract
In today’s hyper-competitive marketplace, the crucial role of the sustainability concept has been highlighted more. Hence, managers’ attention has been attracted to the concept of sustainable supply chains. On the other hand, after the COVID-19 outbreak, the importance of medical devices and their demand has drastically enhanced, which has led to shifting the attention of researchers toward this industry. In this regard, based on the importance of the mentioned points, the current study configures a sustainable supply chain network for the medical devices industry. In this way, given the crucial role of the oxygen concentrator during the COVID-19 outbreak, the present study investigates the supply chain of the mentioned goods as a case study. Also, this research develops an efficient hybrid solution method based on goal programming, a heuristic algorithm, and the simulated annealing algorithm to solve the suggested model. Eventually, sensitivity analysis is conducted to examine the influence of the crucial parameters of the model on the outputs, and managerial insights are provided. According to the achieved results, the suggested model and the developed hybrid method demonstrate a good performance which shows their efficiency.
Keywords: Sustainable supply chain, Closed-loop supply chain, Information sharing, Oxygen concentrator, Heuristic algorithm
Introduction
In the last decade, due to the dramatic progress of the digital industry and information technology, fundamental changes took place in the businesses and industries known as Industry 4.0 (I4.0) (de Sousa Jabbour et al. 2018; Kumar and Singh 2021). There are several tangible examples of the achievements of the I4.0, which have a significant impact on the business environment. For instance, we can refer to employing the information-sharing systems (ISSs), which have drastically grown in the I4.0 era. Information-sharing systems lead to disclosing the issues and challenges in the businesses by enhancing trust and visibility (Mehrjerdi and Shafiee 2020). The mentioned points demonstrate that considering the I4.0 achievements (e.g., ISS) can result in a significant positive impact on supply chain productivity.
In the last two decades, enhancing the business environment competitive space, the importance of the supply chain (SC) problem has dramatically been highlighted (Mahata et al. 2021; Nayeri et al. 2021; Goodarzian et al. 2022; Safaei et al. 2022). For this reason, recently, many studies have been conducted regarding the SC network design (SCND) problem (Tirkolaee et al. 2021b). At the outset, researchers only focused on the economic aspects of the SC and only considered the financial objective (Sazvar et al. 2021b). But, due to the emergence of some environmental issues such as global warming and increasing waste, the attention of researchers attracted toward the SCND problem considering the environmental impact, so-called the green supply chain (GrSC) (Zarrat Dakhely Parast et al. 2021; Alamroshan et al. 2022; Babaeinesami et al. 2022). Afterwards, to achieve the pillars of sustainable development, researchers incorporated the social impacts in the GrSC problem and designed the sustainable SC network (SSCN) (Nayeri et al. 2020; Fallahpour et al. 2021b; Navazi et al. 2021; Shafiee et al. 2021; Afrasiabi et al. 2022). In general, the SSCN attempts to balance the social, economic, and environmental aspects of the SC (Mardani et al. 2020; Fallahpour et al. 2021a; Mamashli et al. 2021b; Navazi et al. 2021; Tirkolaee et al. 2021a, 2022b; Nayeri et al. 2022; Vahdani and Sazvar 2022).
Lung infection in patients with coronary artery disease reduces blood oxygen levels. About 20% of patients develop a severe lung infection, which can manifest as shortness of breath, sometimes coughing, and decreased oxygen levels in the blood and the patient may need an oxygen concentrator device. Usually, lung infection begins on the 6th and 7th days and lasts until the 10th and 11th days, and in this situation, the patient must use the oxygen concentrator device immediately in hospitals or even at home (Ing et al. 2021). Oxygen concentrators are medical devices that can filter nitrogen from room air and provide more oxygen to patients. In many people who suffer from chronic diseases and need oxygen therapy, such devices can help improve their breathing. Furthermore, the number of patients in need of medical oxygen is expected to increase gradually as the population ages, the incidence of chronic respiratory diseases increases, and the impact of coronary heart disease on the lungs (Thakur and Mahato 2022). Figure 1, published by the Maximize Market Research Institute,1 clearly shows the continuous increase in the demand for this device.
Fig. 1.

Oxygen concentrator market growth in 2018–2026
Based on the importance of the abovementioned issues and motivated by real-world case studies, this research attempts to design a sustainable closed-loop supply chain network (SCLSC) considering ISSs. For this purpose, a multi-objective mathematical model (MOMM) is suggested. Then, the oxygen concentrator device is selected as a case study owing to its crucial role during the COVID-19 pandemic. Afterwards, since the research problem is an NP-hard one, the current study develops a heuristic-based hybrid algorithm to solve the suggested MOMM in a reasonable time. This algorithm is developed by combining the multi-choice goal programming with utility function (MCGP-UF) method, a heuristic algorithm, and the simulated annealing (SA) algorithm. After the COVID-19 outbreak, the demand for medical devices has dramatically increased, which has led to several issues in the logistics processes of this industry. In this way, investigating the supply chain problem for the medical devices industry can be very useful in practice. On the other side, the COVID-19 pandemic has occurred in the industry 4.0 era in which the digital industry and data science have dramatically grown. Hence, employing the achievements of this era such as information-sharing systems can solve many issues in the supply chain problem, which were rarely addressed by previous researchers. The mentioned points are the main motivations of the present work. Also, this study aims to answer the following questions:
-
(i)
How are the sustainability dimensions and information-sharing systems considered in the design of the medical devices supply chain network?
-
(ii)
How can an efficient hybrid algorithm be proposed to solve this model?
-
(iii)
What are the main managerial implications of the research problem?
In general, the main advantages of the current study over the previous papers are as follows.
The current research is among the first ones that investigate the sustainable CLSC network design problem considering the information systems. In this regard, studying the CLSC network design problem, in which the sustainability pillars and information-sharing systems have been simultaneously considered, has been rarely addressed in the literature.
This research develops an efficient heuristic-based hybrid algorithm to solve the problem. Since the CLSC problem is an NP-Hard one, using heuristic/metaheuristic algorithms can help to solve the problem in a reasonable time.
The present research investigates the logistics process of the oxygen concentrator, which is one of the widely used products during the COVID-19 pandemic. The demand and importance of the mentioned product have drastically increased during the recent pandemic, which has created enough motivation for this paper to investigate the supply chain of this product.
In the current work, the “Literature review” section reports the literature review, and the “Formulating the research problem” section presents the research problem. The methodology of the current paper is presented in the “Solution method” section. The “Numerical results” section provides the case study and numerical results. Eventually, the “Conclusions” section presents conclusions and future research suggestions.
Literature review
Due to the nature of the current research, we categorize the literature into three sections: (i) sustainable CLSC, (ii) information-sharing systems and SCs, and (iii) research gaps and contributions.
Sustainable CLSC
In this section, we report some of the most related studies in the field of sustainable CLSC (SCLSC). In this area, a fuzzy programming model was offered by Pishvaee et al. (2014) to configure an SCLSC for the syringe. The authors employed the Benders decomposition approach to solve the suggested model. Zhalechian et al. (2016) designed an SCLSC network in which location and routing problems were considered by proposing a mathematical programming model. They developed several metaheuristic algorithms to handle the complexity of the offered model and solve it. A mathematical programming model was proposed by Soleimani et al. (2017) to design an SCLSC. The authors also extended the Genetic Algorithm (GA) to solve the problem. The achieved results demonstrated that the proposed method can obtain high-quality solutions. Mota et al. (2018) attempted to design an SCLSC network for the electronic industry by proposing a MOMM. The proposed MOMM could make several decisions, such as technology selection, allocation, supplier selection, and transportation mode selection. An SCLSC was configured by Pourjavad & Mayorga (2018) using a MOMM. To tackle the complexity of the suggested model, the authors developed an NSGA-II algorithm to solve the research problem. The obtained outputs showed that the proposed algorithm outperformed the others. A hybrid approach was developed by Govindan et al. (2019) to design an SCLSC network considering a case study in the field of the automotive parts industry. In this regard, the authors combined the multiple-attribute decision-making methods with the mathematical programming approach. To configure an SCLSC network, a mathematical model was proposed by Sherafati et al. (2019) to optimize the environmental, social, and financial aspects of the SC. The suggested model could make several tactical and strategic decisions. Rabbani et al. (2020) proposed a MOMM to design an SCLSC with location-allocation decisions. Afterwards, to solve the proposed MOMM, the authors employed the ε–constraint method. Nayeri et al. (2020) configured an SCLSC network using a robust fuzzy MOMM. The authors considered the water tank industry as a case study and applied the MCGP method to solve the suggested model. Salehi-Amiri et al. (2021) configured an SCLSC for the walnut industry. The authors suggested a mathematical model and developed a hybrid method to solve the offered model. Mehrjerdi and Shafiee (2021) designed an SCLSC network considering disruptions. They employed the information-sharing strategy to improve the visibility of information in the SC as one of the resiliency strategies. The authors suggested a multi-objective model and solved it using the -constraint method. An SCLSC network was configured by Khorshidvand et al. (2021) by considering advertising and pricing decisions. The authors proposed a two-stage decision-making framework and applied the Lagrangian relaxation algorithm to solve the research problem. Moheb-Alizadeh et al. (2021) suggested a stochastic MOMM to configure an SCLSC and developed a hybrid solution method to achieve an optimal solution. Gholizadeh et al. (2021) utilized robust and heuristic optimization methods to configure an SCLSC for the dairy industry. They offered a scenario-based model and solved it using the -constraint method.
Akbari-Kasgari et al. (2022) focused on the copper industry and suggested a sustainable and even resilient CLSC network. They selected the copper supply chain since its demand increased and developed two different multi-objective mathematical models one considered backup suppliers and another not. Golpîra and Javanmardan (2022) provided an optimization model for sustainable CLSC. They integrated the carbon emission in their model and solved the model as robust mixed-integer linear programming. They compared the results of the different models considering carbon capacity and trade policy. Their results showed that the carbon cap-trade policy models had more cost but were more robust. Tavana et al. (2022) proposed a multi-objective mathematical model for sustainable CLSC. They first tried to simulate the supply chain involving supplier selection, order allocation, transportation, and all parts of the supply chain to estimate the parameters considering uncertainty and enter the model, and then solved their model using GAMS software.
The mask sustainable CLSC was investigated by Tirkolaee et al. (2022a) in the COVID-19 outbreak. To do this, they developed a MOMILP model for all parts of a supply chain. They considered all dimensions of sustainability optimization in their objective functions. They used the different metaheuristic algorithms to solve the proposed model. Zhang et al. (2022) focused on circular economy and uncertainty impacts on sustainable CLSC problems. They suggested several scenarios in order to add uncertainty in their mathematical model. They tried to maximize the profit, minimize the environmental impacts, and maximize social effects, which are the dimensions of sustainability perspective. A randomly test problem mas generated for validation test. Khalili-Damghani et al. (2022) studied the location-allocation-distribution problem in a cascade disaster using a simulation–optimization approach. In this regard, the authors proposed a bi-objective mathematical programming model and then solved it by the -constraint method in small-sized problems. Eventually, they employed the weed optimization algorithm to solve the problem in the large-sized instances. Shirazi et al. (2021) proposed a mathematical model to design a multi-echelon supply chain. The suggested model could make several decisions, such as location and allocation decisions. It should be noted that the authors developed the SPEA-II, NSGA-II, MOGWO, and MOGWO algorithms to solve the research problem. Behzadianfar et al. (2022) developed a sustainable CLSC in dairy production industry as case study while considered the uncertainty in the fuzzy environment. The fuzzy values used a modified one.
Information-sharing systems and SCs
Many researchers focused on information-sharing systems opportunities, tools, and challenges in different supply chains. In this section, we will review the recent studies carried out on the availability of various information-sharing systems in supply chains to find the research gap. As mentioned, some studies investigated the impact of information-sharing systems on supply chains. For instance, Gonul Kochan et al. (2018) investigated how a cloud-based information-sharing system affects hospital supply chain performance. They modeled the causal loops in a hospital supply chain and the impacts through the system dynamics approach for both traditional and cloud-based information systems available for the drug supply process. Finally, they compared the results in several metrics, such as supply lead time, average inventory level in the drugstore, and missed orders. They concluded that information systems are essential in supply chains, especially emergency ones. Panahifar et al. (2018) studied the impacts of the information-sharing system on supply chain performance and collaboration. For this aim, they used structural equation modeling (SEM) through patrial least squared to calculate for dimensions of information-sharing systems (including trust, information readiness, information accuracy, and information security) on two objectives (sale increase and operation performance). They collected nearly 200 questionnaires and analyzed them. Their results showed that all information-sharing systems dimensions were important, and the security characteristic was the most important one, which affected the firm performance amazingly. Huo et al. (2021) tried to investigate the information-sharing impacts on two dimensions of the supply chain, such as the learning level of both supplier and customer and also the flexibility level. They proposed a conceptual model and tried to validate it through structural equation modeling (SEM) based on expert opinion analysis. Their results indicated that the information-sharing system has a significant impact on learning of all supply chain parts and the more learning level leads to the more flexibility in a supply chain. Nabila et al. (2021) analyzed the information-sharing system alignment on supply chain performance (especially the responsiveness level). They proposed a conceptual model and analyzed the relationships of the variables using SEM. They concluded that there is a strong connection between information sharing and responsiveness. Yuliana et al. (2022) also investigated the effect of information sharing through supply chains on the competitive advantages of different companies using collecting the questionnaires of 70 manufacturers. Some researchers tried to suggest information-sharing systems mechanisms or frameworks in the different dimensions of supply chains. For example, Zhang and Gong (2021) focused on information-sharing mechanisms based on cloud computing for facing the bullwhip effect in a supply chain by developing a mathematical model. Their results showed that information systems could decrease the supply chain costs and risks by more than 10% in a case study. Ghasemi et al. (2021) studied the logistics management problem by proposing a bi-level mathematical model considering the information concepts. The offered model aimed to optimize the allocation and routing decisions in the medical industry. They applied the evolutionary game method to handle the research problem. Mehrjerdi and Shafiee (2021) suggested a resilient-sustainable CLSP considering information-sharing strategies. The authors first prioritized the supply chain resilience dimensions. The most important ones were information sharing and also multiple sourcing. Then, they proposed a MIP model and solved it using augmented ε-constraint according to a case study which was a tire manufacturing company.
Research gaps and contributions
According to the literature, although several works were published in the SC network area, there are still some gaps. In this regard, incorporating the I4.0 achievements, such as information systems, into the CLSC network has rarely been addressed by previous studies. Hence, to cover the mentioned gaps, the current study aims at proposing a multi-objective mathematical model to configure a sustainable CLSC considering the information systems for the medical devices industry. In this regard, the oxygen concentrator device, as one of the most important and widely used products during the COVID-19 outbreak, is considered as a case study. On the other side, solving the problem has two challenges. The first challenge is the multi-objective nature of the offered model, and the second one is the complexity of the research problem. To overcome these issues, this study attempts to develop a heuristic-based hybrid method to solve the proposed model. In this regard, at the outset, the proposed MOMM converts to a single-objective model using the MCGP-UF method, and a heuristic-based simulated annealing (HBSA) algorithm is developed to solve the research problem in a reasonable time. In general, the present study contributes to the literature by the two main novelties as follows. The first one is to design the medical devices supply chain network considering the sustainability pillars and information-sharing systems, which were ignored by previous researchers. Also, the second one is to develop a heuristic-based hybrid solution method that can solve the research problem, efficiently. Based on the mentioned discussions, the main contributions of the current research are as follows.
This research is among the first ones that propose a decision-making framework to design a sustainable closed-loop supply chain network considering information systems.
This study develops an efficient hybrid solution method based on the MCGP-UF method, a heuristic algorithm, and the simulated annealing algorithm (HSAMCGP), which can efficiently solve the offered multi-objective model in a reasonable time.
This study selects one of the most important and widely used products during the recent pandemic (COVID-19) as a case study.
Formulating the research problem
Problem definition
The current study focuses on the CLSC network configuration problem considering sustainable development pillars and information-sharing systems. In this regard, a MOMM is proposed to design a CLSC network. This network has four echelons in the forward chain involving suppliers, manufacturers, distribution centers (DCs), and customers. On the other side, reverse logistics consists of collection centers (CCs), repairing centers (RECs), recycling centers (RCCs), second-hand markets (SM), and disposal centers. The materials flow in the network is as follows. At the outset, the required raw materials are bought from suppliers and shipped to manufacturers. There are both domestic and international suppliers, and the exchange rate and customs duty are considered for the international suppliers. Afterwards, the products are manufactured and sent to the DCs for satisfying the demand of customers. It should be noted that the shortage is allowed, but we consider the service level for the SC that is calculated based on the ratio of the met demand over the total demand. In the CCs, the products are inspected for their quality. Reusable products are sent to RECs to repair and sold in SMs. On the other hand, the remaining products are shipped to RCCs to recycle their materials. In RCCs, materials successfully recycled are sold to the suppliers while the remaining materials are sent to the disposal centers. Figure 2 depicts the considered CLSC network.
Fig. 2.

The designed CLSC network
Assumptions
The location of the facilities is pre-defined (Nayeri et al. 2020).
The problem is studied under capacity constraints (Pedram et al. 2017).
Shortage is allowed (Nayeri et al. 2021).
The exchange rate and customs duty are considered for international suppliers (Amin and Baki 2017).
The service level is measured based on the ratio of the met demand over the total demand (Sabouhi et al. 2020).
Mathematical model
According to the aforementioned descriptions, the suggested MOMM is as follows.
| Indices | |
| Set of raw materials (RMs) indexed by r | |
| Set of suppliers indexed by s | |
| Set of manufacturers indexed by i | |
| Set of DCs indexed by j | |
| Set of customers indexed by k | |
| Set of CCs indexed by c | |
| Set of RECs indexed by q | |
| Set of SMs indexed by h | |
| Set of RCCs indexed by b | |
| Set of disposal centers indexed by d | |
| Set of manufacturing technologies indexed by t | |
| Set of countries in which international suppliers are located indexed by | |
| Set of information-sharing systems (ISS) indexed by f | |
| Parameters | |
| Cost of contracting with supplier s located country n | |
| Fixed-Cost (FC) of opening manufacturer i by technology t | |
| FC of opening DC j | |
| FC of opening CC c | |
| FC of opening REC q | |
| FC of opening RCC b | |
| FC of establishing ISS f | |
| Cost of buying raw material r from supplier s located in country n | |
| Manufacturing cost for technology t in manufacturer i | |
| Operation costs of DC j | |
| Operation costs of CC c | |
| Cost of repairing products in REC q | |
| Cost of recycling components in RCC b | |
| The shortage cost | |
| Customs duty rate of RM r supplied from a supplier located in country n (it is equal to zero for the domestic suppliers) | |
| Exchange rate of the currency of country n (it is equal to 1 for the domestic suppliers) | |
| Unit of transportation cost | |
| The selling price of components in SM h | |
| The selling price for recycled material | |
| The capacity of supplier s located in country n for RM r | |
| The capacity of manufacturer i with technology t | |
| The capacity of DC j | |
| The capacity of CC c | |
| The capacity of REC q | |
| The capacity of RCC b | |
| The demand of customers k | |
| Distance between facility and facility ; | |
| The utilization rate of raw material r in the product | |
| Rate of return of products for customers k | |
| The percentage of the repairable returned products | |
| The percentage of components that are successfully recycled | |
| The quantity of materials obtained from recycling the product | |
| Carbon emission due to the manufacturing process in manufacturer i using technology t | |
| Carbon emission due to the repairing process in REC q | |
| Carbon emission due to the recycling process in RCC b | |
| Carbon emission due to the transportation process | |
| The job opportunity created by establishing a facility | |
| The percent of the information that can be exchanged in the whole SC network using ISS f | |
| Decision variables | |
| A binary variable that shows whether supplier s located country n is selected or not | |
| A binary variable that shows whether manufacturer i with technology t is opened or not | |
| A binary variable that shows whether DC j is opened or not | |
| A binary variable that shows whether CC c is opened or not | |
| A binary variable that shows whether REC q is opened or not | |
| A binary variable that shows whether RCC b is opened or not | |
| A binary variable that shows whether ISS f is established or not | |
| The quantity of RM r sent from supplier s located in country n to manufacturer i | |
| The quantity of product sent from manufacturer i with technology t to DC j | |
| The quantity of product sent from DC j to customers k | |
| The quantity of returned product sent from customers k to CC c | |
| The quantity of products sent from CC c to REC q | |
| The quantity of products sent from CC c to RCC b | |
| The quantity of repaired products sent from REC q to SM h | |
| The quantity of wastes sent from RCC b to disposal center d | |
| The quantity of recycled materials sent from RCC b to supplier s located in country n | |
| The quantity of shortage for the customers k | |
| The quantity of visibility of information in the supply chain networks when ISS f is established | |
| The service level | |
The first objective function (OF) minimizes the total cost of the SC. The total cost is including the fixed costs, purchasing costs, production costs, DCs, CCs, RECs, and RCCs operation costs, shortage costs, and transportation costs ( denotes the flow of materials/products between facility and ). It should be noted that the obtained revenue from selling repaired products and recycled materials is deduced from the total cost.
| 1 |
The second OF aims to minimize the total environmental impacts and also maximize the social impacts. Since the mentioned factors have different units, the OF is written in the weighted normalized sum version. In Eq. (2), and respectively show the weight of the environmental aspect and the weight of the social aspect (). and represent the maximum and minimum values for the environmental impact, respectively. Finally, and receptively are the maximum and minimum values for the social impact.
| 2 |
The third OF maximizes the visibility of information in the SC and also the service level.
| 3 |
Constraint (4) calculates the quantity of purchased RMs from suppliers. Relation (5) is the capacity constraint of suppliers. Constraint (6) measures the quantity of products sent from manufacturers to DCs. Relation (7) shows the limitation of the capacity of the manufacturer. Also, constraint (8) indicates that each manufacturer only can be opened with one technology. Relation (9) calculates the quantity of products sent to the customers and also measures the amount of shortages. Equation (10) is the capacity constraint of the DCs.
| 4 |
| 5 |
| 6 |
| 7 |
| 8 |
| 9 |
| 10 |
Equation (11) calculates the quantity of the returned products. Relations (12) and (13) demonstrate the quantity of products sent from the CCs to the RECs and the RCCs, respectively. Relation (14) is the capacity constraint of the CCs. Constraint (15) shows the quantity of repaired products sent to SMs. Constraints (16) and (17) respectively calculate the quantity of materials shipped from RCCs to suppliers and disposal centers. Relations (18) and (19) show the capacity constraints of RECs and RCCs, respectively.
| 11 |
| 12 |
| 13 |
| 14 |
| 15 |
| 16 |
| 17 |
| 18 |
| 19 |
Relation (20) measures the service level.
| 20 |
Constraint (21) calculates the visibility of information in the SC. Relation (22) ensures that an information-sharing system must be established within the SC.
| 21 |
| 22 |
Solution method
This research developed a hybrid method based on a heuristic algorithm, the multi-choice goal programming with utility function (MCGP-UF) method, and the SA algorithm. The main reasons for employing each of the mentioned approaches are as follows: (i) the MCGP-UF method considers the decision maker’s preference value, (ii) the MCGP-UF method was widely employed in the previous related studies and showed good performance, (iii) the SA algorithm is selected based on its quick convergence, simple concept, and easy implementation, (iv) the SA algorithm has a good performance in the previous related studies, and (v) the heuristic algorithm was employed in the previous studies in the field of supply chain and showed good performance.
MCGP-UF
As mentioned, this study uses the MCGP-UF method, which was developed by Chang (2011), to convert the suggested MOMM to a single-objective model. The main reasons for selecting the MCGP-UF are as follows: (i) this method considers the decision maker’s preference value (Nayeri et al. 2018), and (ii) this method was widely employed in the previous related studies and showed good performance (for example see (Cheraghalipour and Farsad 2018; Nayeri et al. 2020; Rostami et al. 2020; Shafipour-omran et al. 2020; Mamashli et al. 2021a; Sazvar et al. 2021a)). The formulation of this method is as follows, where is the range of the aspiration level for kth OF. The positive and negative deviations of the OFs from are denoted by and , respectively. represents a continuous decision variable, is the utility function for kth OF, and shows the normalized deviation of from .
S.t.
| 23 |
Model constraint sets
It should be noted that the objective function of the above model can be normalized as follows, where and are the positive and negative ideal solutions, respectively.
| 24 |
Simulated annealing
One of the widely used methods to solve complex problems is the SA algorithm developed by (Kirkpatrick et al. 1983). This method, which was inspired by the annealing process of solids, is a single-solution–based metaheuristic algorithm. This algorithm first generates a solution and calculates its objective function. Then, by employing some procedures, a new solution named the neighborhood solution is created, and its objective function is measured. Afterwards, if the new solution has a better objective function than the old one, it has been selected as the solution. Otherwise, the new solution may be selected based on a probability that is calculated by (- ). In the mentioned expression, shows the temperature, and represents the difference between the value of objective functions of the new and old solutions.
Solution structure
To generate the initial solution, the current study utilizes a two-stage procedure. This approach which has been widely used in the related literature can help scholars handle their issues with various algorithms and operators (Devika et al. 2014; Hajiaghaei-Keshteli and Fard 2019). To better understand the way of creating the solution, we describe it according to an example for five suppliers ( to ) and four manufacturers ( to ) (see Fig. 3). Based on Fig. 3a, which shows the first sub-solution of the solution, random numbers in interval (0.1) are generated to create a random vector. This sub-solution is employed to determine the value of the binary variables (e.g., and ). In this section, if the value of the random number is greater than 0.5, it is converted to 1, and otherwise, it is converted to zero (see Fig. 3a). Also, another sub-solution (Fig. 3b) is employed for determining the flow of materials in the supply chain. In this sub-solution, at the outset, similar to the previous one, if the value of a random number is greater than 0.5, it is considered equal to 1. For instance, in Fig. 3b, provides the needed raw materials for M1 and M4, and S5 provides the raw materials for and .
Fig. 3.

An example of the employed two-stage solution structure. a The first sub-solution. b The first sub-solution
Creating neighbor solution
The main operator of the SA algorithm is creating the neighbor solution. This operator tries to improve the current solution to a better one. This study employs a procedure, which is shown in Fig. 4, to generate the new solution. According to this approach, at first, the elements of two columns, which are randomly selected, are swapped.
Fig. 4.

The procedure of creating the neighbor solution
Combination of the SA algorithm and the MCGP-UF (SA-GP)
As aforementioned, this study employs the MCGP-UF method for converting the offered MOMM to a single-objective model and then applies the SA algorithm to solve the research problem. This way, this section aims to describe the way of combining the SA and MCGP-UF methods. At the outset, The SA algorithm generates an initial solution, and then for each OF the aspiration levels (i.e., ), the positive ideal solution, and the negative ideal solution are calculated. Afterwards, the SA improved the solution based on the value of the objective function of the MCGP-UF (objective function of model (23)). Figure 5 shows the flowchart of the SA-GP method.
Fig. 5.

The flowchart of the SA-GP algorithm
The heuristic algorithm
In this study, in order to improve the performance of the SA algorithm, we utilize a heuristic algorithm within the SA algorithm. This heuristic algorithm generates an effective initial solution for the SA and then SA improves this solution in its loop. It should be noted that the main reason for selecting this algorithm is that it was employed in the previous studies in the field of supply chain and showed good performance (for example see Kaur and Singh 2018; Gholizadeh et al. 2021; Homayouni et al. 2021; Sazvar et al. 2021b; Asadi et al. 2022). Figure 6 shows the steps of this algorithm (Kaur and Singh 2018; Sazvar et al. 2021b).
Fig. 6.
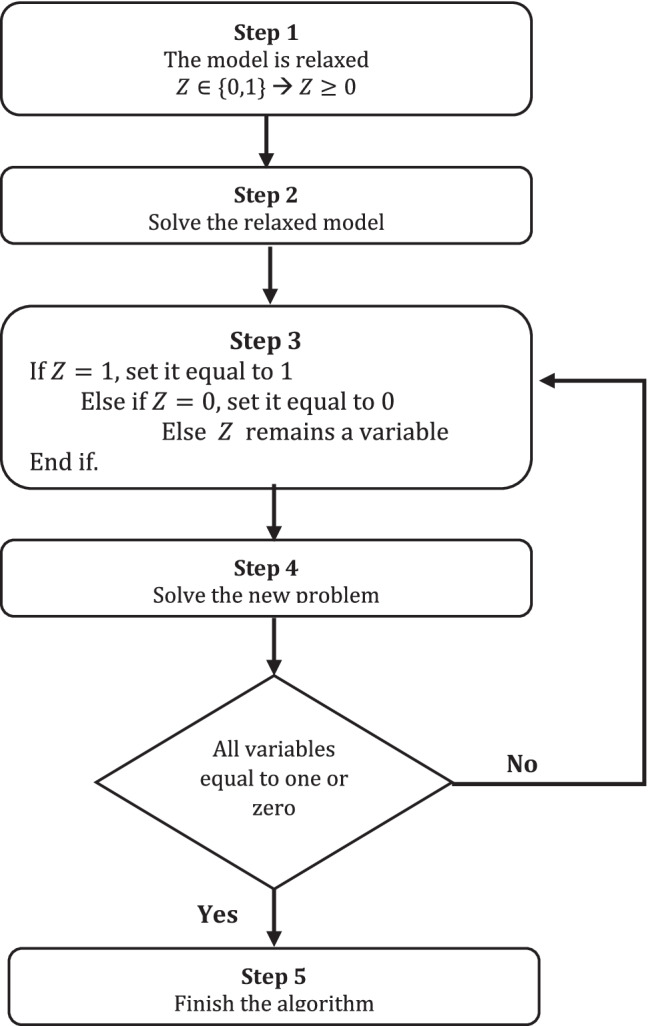
Steps of the heuristic algorithm
The proposed hybrid method
In this section, the way of combining the mentioned methods to develop an efficient solution method for solving the research problem is presented. In this way, at the outset, by using the heuristic method within MCGP-UF, the suggested model is solved. In the next step, the obtained solution is applied as the initial solution for the SA algorithm. Eventually, the SA algorithm improved the current solution to achieve the best solution. The pseudo-code of the developed hybrid method is depicted in Fig. 7.
Fig. 7.

The pseudo code of the developed hybrid algorithm
Numerical results
Case study
The COVID-19 pandemic has disrupted the world a lot in the past 2 years (Goodarzian et al. 2021a). This disease, which causes problems in the body’s respiratory system, has caused many casualties during this period. During this outbreak, one of the industries, which has played a crucial role in improving the performance of health services, is the medical devices industry (Shirazi et al. 2020; Babaee Tirkolaee and Aydın 2021; Goodarzian et al. 2021b; Tirkolaee et al. 2022a). In this field, one of the widely used devices is the oxygen concentrator. This is a vital device that provides the required oxygen for patients with low oxygen levels. This research considers a company in Iran that produces medical devices involving the oxygen concentrator. The main raw materials needed for manufacturing this product are given in Table 1. Also, Table 2 shows the other necessary parameters. The international suppliers of the firm are located in Russia, China, and Turkey.
Table 1.
The information regarding the raw materials

Table 2.
The value of some parameters of the suggested model
| Parameter | Value |
|---|---|
| (Rials) | U [30, 50] |
| (Rials) | U [2000, 3000] |
| (Rials) | U [2000, 3000] |
| (Rials) | U [5000, 6000] |
| (Rials) | U [4000, 5000] |
| (Rials) | U [1.5, 2] |
| U [100, 200] | |
| (Rials/kg-km) | U[0.115 0.120] |
| U [0.5, 1.5] | |
| U [0.03, 0.08] | |
| U [600 750] | |
| U [0.5 0.75] | |
| U [0.4 0.7] | |
| U [0.65 0.85] | |
| U [350 750] | |
| U [350 550] | |
| U [250 400] | |
| U [50 100] |
Parameters setting
Since one of the most important factors in the performance of a metaheuristic algorithm is the value of its parameters, the parameter setting plays an important role in the quality of the outputs (Razavi et al. 2020). Therefore, in this study, the Taguchi method is employed to tune the parameters of the SA algorithm. This method selects the best value for parameters based on the signal-to-noise () ratio, which is calculated based on relation (25).
| 25 |
Table 3 presents the levels and values considered for each parameter, which are selected based on the literature.
Table 3.
The candidate values for parameters
| Parameter | Level | ||
|---|---|---|---|
| 1 | 2 | 3 | |
| 35 | 40 | 45 | |
| 250 | 300 | 350 | |
| 0.97 | 0.98 | 0.99 | |
It should be noted that in the ratio chart, a higher level for a parameter shows its best value. Based on Fig. 8, which illustrates the ratio chart, the best value for each parameter is as follows: =45, = 300, =0.99.
Fig. 8.

The ratio chart for the SA algorithm
Computational results
This section is dedicated to providing the results of solving the problem. To this end, we have generated 30 test problems in small and large sizes. To evaluate the performance of the developed hybrid method, we also solve the suggested model using the combination of the MCGP-UF method with two traditional algorithms namely GA, and PSO, and compare their results with the hybrid HSAMCGP algorithm. Since in the small-sized instances, the optimal solution can obtain via the exact method. Hence, in the small-sized test problems, the solutions of the HSAMCGP are compared with the solutions achieved by the MCGP-UF method, too. Table 4 presents the outputs of solving the suggested model in small-sized instances using the algorithms. In this table, the value of each OF, and the CPU time are reported. On the other side, Table 5 shows the gap between the algorithms’ solutions and the optimal solution. It should be noted that the is calculated based on the following relation, where represents the solution achieved by the algorithm and shows the optimal solution.
| 26 |
Table 4.
The output of the algorithms for solving the small-sized instances
| Problem | Exact (MCGP-UF) | SA-GP | GA-GP | PSO-GP | HSAMCGP | |||||||||||||||
|---|---|---|---|---|---|---|---|---|---|---|---|---|---|---|---|---|---|---|---|---|
| Z1 | Z2 | Z3 | CPU time (s) | Z1 | Z2 | Z3 | CPU time | Z1 | Z2 | Z3 | CPU time | Z1 | Z2 | Z3 | CPU time | Z1 | Z2 | Z3 | CPU time | |
| 1 | 8837.2 | 0.082 | 1.825 | 26.3 | 8837.2 | 0.082 | 1.825 | 16.8 | 8837.2 | 0.082 | 1.825 | 31.5 | 8837.2 | 0.082 | 1.825 | 29.3 | 8837.2 | 0.082 | 1.825 | 23.7 |
| 2 | 9246.6 | 0.144 | 1.749 | 37.5 | 9246.6 | 0.144 | 1.749 | 19.5 | 9246.6 | 0.144 | 1.749 | 38.2 | 9246.6 | 0.144 | 1.749 | 35.6 | 9246.6 | 0.144 | 1.749 | 27.5 |
| 3 | 9675.4 | 0.195 | 1.864 | 94.6 | 9740.2 | 0.196 | 1.852 | 23.4 | 9735.0 | 0.196 | 1.862 | 46.1 | 9742.8 | 0.196 | 1.852 | 42.9 | 9675.4 | 0.195 | 1.863 | 32.9 |
| 4 | 9943.2 | 0.278 | 1.754 | 175.1 | 10,035.7 | 0.280 | 1.738 | 26.8 | 10,028.3 | 0.280 | 1.752 | 52.3 | 10,039.4 | 0.280 | 1.738 | 48.7 | 9943.2 | 0.278 | 1.753 | 37.7 |
| 5 | 10,488.7 | 0.251 | 1.766 | 238.5 | 10,635.5 | 0.254 | 1.742 | 30.2 | 10,623.8 | 0.254 | 1.763 | 59.5 | 10,641.4 | 0.254 | 1.742 | 55.4 | 10,488.7 | 0.251 | 1.765 | 42.5 |
| 6 | 10,843.1 | 0.366 | 1.857 | 482.8 | 11,038.3 | 0.371 | 1.841 | 34.1 | 11,022.7 | 0.371 | 1.854 | 66.7 | 11,046.1 | 0.372 | 1.827 | 62.1 | 10,936.4 | 0.368 | 1.856 | 48.0 |
| 7 | 11,164.5 | 0.485 | 1.799 | 682.8 | 11,421.3 | 0.495 | 1.782 | 39.4 | 11,400.7 | 0.494 | 1.795 | 72.4 | 11,431.6 | 0.496 | 1.761 | 67.4 | 11,309.6 | 0.490 | 1.798 | 55.5 |
| 8 | 11,495.3 | 0.337 | 1.725 | 951.3 | 11,713.7 | 0.342 | 1.722 | 44.7 | 11,696.2 | 0.342 | 1.721 | 79.1 | 11,722.4 | 0.343 | 1.693 | 73.6 | 11,713.7 | 0.342 | 1.723 | 62.9 |
| 9 | 12,072.5 | 0.568 | 1.738 | 1706.5 | 12,374.3 | 0.581 | 1.720 | 49.5 | 12,350.2 | 0.580 | 1.733 | 87.5 | 12,386.4 | 0.582 | 1.696 | 81.5 | 12,253.6 | 0.575 | 1.737 | 69.7 |
| 10 | 12,368.1 | 0.715 | 1.779 | 2646.2 | 12,726.8 | 0.734 | 1.755 | 56.3 | 12,698.1 | 0.732 | 1.774 | 96.3 | 12,741.1 | 0.734 | 1.729 | 89.7 | 12,590.7 | 0.725 | 1.777 | 79.3 |
| 11 | 12,953.8 | 0.626 | 1.616 | 4085.9 | 13,381.3 | 0.645 | 1.595 | 61.2 | 13,347.1 | 0.644 | 1.610 | 102.8 | 13,398.4 | 0.646 | 1.564 | 95.7 | 13,225.8 | 0.637 | 1.614 | 86.2 |
| 12 | 14,066.2 | 0.884 | 1.748 | 6428.5 | 14,572.6 | 0.912 | 1.723 | 67.6 | 14,532.1 | 0.910 | 1.741 | 110.1 | 14,592.8 | 0.913 | 1.688 | 102.5 | 14,403.8 | 0.901 | 1.745 | 95.2 |
| 13 | 14,859.9 | 0.912 | 1.745 | 9067.1 | 15,320.6 | 0.938 | 1.733 | 72.3 | 15,283.7 | 0.935 | 1.739 | 118.6 | 15,339.0 | 0.939 | 1.692 | 110.4 | 15,261.1 | 0.933 | 1.743 | 101.8 |
| 14 | 15,724.7 | 0.857 | 1.778 | 12,796.3 | 16,385.1 | 0.890 | 1.744 | 77.8 | 16,332.3 | 0.887 | 1.769 | 125.3 | 16,411.6 | 0.891 | 1.705 | 116.7 | 16,117.8 | 0.875 | 1.775 | 109.5 |
| 15 | 16,158.2 | 0.925 | 1.766 | 15,449.5 | 16,901.5 | 0.964 | 1.736 | 83.6 | 16,842.0 | 0.961 | 1.757 | 134.5 | 16,931.2 | 0.965 | 1.687 | 125.2 | 16,659.1 | 0.950 | 1.763 | 117.7 |
Table 5.
The obtained gaps
| Problem | SA-GP | GA-GP | PSO-GP | HSAMCGP | ||||||||
|---|---|---|---|---|---|---|---|---|---|---|---|---|
| GAP1 | GAP2 | GAP3 | GAP1 | GAP2 | GAP3 | GAP1 | GAP2 | GAP3 | GAP1 | GAP2 | GAP3 | |
| 1 | 0 | 0 | 0 | 0 | 0 | 0 | 0 | 0 | 0 | 0 | 0 | 0 |
| 2 | 0 | 0 | 0 | 0 | 0 | 0 | 0 | 0 | 0 | 0 | 0 | 0 |
| 3 | 0.67 | 0.55 | 0.61 | 0.62 | 0.51 | 0.56 | 0.70 | 0.57 | 0.63 | 0 | 0 | 0 |
| 4 | 0.93 | 0.86 | 0.89 | 0.86 | 0.79 | 0.82 | 0.97 | 0.89 | 0.93 | 0 | 0 | 0 |
| 5 | 1.4 | 1.2 | 1.3 | 1.3 | 1.0 | 1.2 | 1.5 | 1.1 | 1.4 | 0 | 0 | 0 |
| 6 | 1.8 | 1.5 | 1.6 | 1.7 | 1.4 | 1.5 | 1.9 | 1.6 | 1.7 | 0.86 | 0.67 | 0.75 |
| 7 | 2.3 | 2.1 | 2.1 | 2.1 | 1.9 | 1.9 | 2.4 | 2.2 | 2.2 | 1.3 | 1.1 | 1.2 |
| 8 | 1.9 | 1.6 | 1.8 | 1.7 | 1.5 | 1.7 | 2.0 | 1.7 | 1.9 | 1.9 | 1.4 | 1.7 |
| 9 | 2.5 | 2.4 | 2.4 | 2.3 | 2.1 | 2.2 | 2.6 | 2.4 | 2.5 | 1.5 | 1.2 | 1.4 |
| 10 | 2.9 | 2.6 | 2.8 | 2.7 | 2.4 | 2.6 | 3.0 | 2.7 | 2.9 | 1.8 | 1.4 | 1.5 |
| 11 | 3.4 | 3.1 | 3.3 | 3.0 | 2.9 | 2.9 | 3.4 | 3.2 | 3.3 | 2.1 | 1.8 | 2 |
| 12 | 3.6 | 3.2 | 3.4 | 3.3 | 2.9 | 3.1 | 3.7 | 3.3 | 3.5 | 2.4 | 1.9 | 2.1 |
| 13 | 3.2 | 2.9 | 3.1 | 2.9 | 2.6 | 2.8 | 3.2 | 2.9 | 3.1 | 2.7 | 2.3 | 2.4 |
| 14 | 4.2 | 3.9 | 4.1 | 3.9 | 3.5 | 3.8 | 4.4 | 4.0 | 4.3 | 2.5 | 2.1 | 2.3 |
| 15 | 4.6 | 4.3 | 4.5 | 4.2 | 3.9 | 4.1 | 4.8 | 4.4 | 4.7 | 3.1 | 2.7 | 2.9 |
| Average | 2.11 | 2.10 | 2.18 | 1.22 | ||||||||
Based on the obtained outputs, the developed algorithm (HSAMCGP) can achieve high-quality solutions (i.e., solutions with small gaps from the optimal solution) in a reasonable time. In terms of the CPU time, the SA algorithm outperforms the other ones (see Fig. 9, which compares the algorithm based on the CPU time metric). On the other side, the outputs demonstrate that the developed HSAMCGP has the best performance in terms of the solutions’ quality. In this regard, as can be seen in Table 5, the average of gaps () for the HSAMCGP is equal to 1.22, which is significantly better than the of the other algorithms. To better understand, see Fig. 10.
Fig. 9.

The comparison of the algorithms according to the CPU time metric
Fig. 10.

Comparing the performance of the algorithms in terms of the quality of the solutions
On the other side, Table 6 presents the achieved solutions for the large-sized instances. In the large-sized test problems, we have used the relative percentage deviation (RPD) metric, which is calculated according to relation (27), to compare the algorithms in terms of the quality of solutions. In Eq. (27), is the best solution achieved among all of the algorithms. The values of RPD for each algorithm and each objective function are given in Table 7.
| 27 |
Table 6.
The output of the algorithms for solving the small-sized instances
| Problem | SA-GP | GA-GP | PSO-GP | HSAMCGP | ||||||||||||
|---|---|---|---|---|---|---|---|---|---|---|---|---|---|---|---|---|
| Z1 | Z2 | Z3 | CPU time (s) | Z1 | Z2 | Z3 | CPU time (s) | Z1 | Z2 | Z3 | CPU time (s) | Z1 | Z2 | Z3 | CPU time (s) | |
| 1 | 22,284.9 | 0.893 | 1.701 | 95.3 | 22,253.0 | 0.892 | 1.699 | 175.4 | 22,314.23 | 0.894 | 1.703 | 163.5 | 22,018.5 | 0.883 | 1.681 | 145.4 |
| 2 | 27,248.1 | 0.941 | 1.748 | 99.8 | 27,188.7 | 0.939 | 1.745 | 189.8 | 27,302.58 | 0.942 | 1.751 | 176.9 | 26,753.2 | 0.926 | 1.725 | 154.8 |
| 3 | 31,027.7 | 0.807 | 1.658 | 105.6 | 30,939.4 | 0.805 | 1.653 | 195.5 | 31,108.66 | 0.809 | 1.661 | 182.2 | 30,291.6 | 0.792 | 1.623 | 163.5 |
| 4 | 36,256.5 | 0.871 | 1.699 | 109.4 | 36,159.5 | 0.869 | 1.695 | 205.1 | 36,345.43 | 0.872 | 1.703 | 191.2 | 35,448.3 | 0.856 | 1.664 | 177.1 |
| 5 | 41,593.2 | 0.943 | 1.669 | 115.7 | 41,424.0 | 0.939 | 1.663 | 218.4 | 41,748.36 | 0.946 | 1.675 | 203.5 | 40,182.8 | 0.914 | 1.615 | 189.4 |
| 6 | 45,812.9 | 0.868 | 1.640 | 120.2 | 45,640.3 | 0.865 | 1.633 | 231.2 | 45,971.01 | 0.871 | 1.645 | 215.5 | 44,375.1 | 0.843 | 1.589 | 200.2 |
| 7 | 50,182.2 | 0.917 | 1.736 | 125.6 | 49,943.9 | 0.913 | 1.728 | 245.6 | 50,400.62 | 0.920 | 1.743 | 228.9 | 48,196.5 | 0.885 | 1.672 | 211.6 |
| 8 | 54,810.8 | 0.954 | 1.717 | 129.1 | 54,562.1 | 0.950 | 1.709 | 248.7 | 55,038.8 | 0.957 | 1.724 | 231.8 | 52,738.2 | 0.921 | 1.655 | 220.7 |
| 9 | 60,211.3 | 0.829 | 1.788 | 136.4 | 59,900.2 | 0.825 | 1.779 | 257.5 | 60,496.54 | 0.833 | 1.796 | 240.0 | 57,618.5 | 0.796 | 1.713 | 229.5 |
| 10 | 65,030.6 | 0.927 | 1.693 | 142.8 | 64,714.6 | 0.923 | 1.685 | 268.1 | 65,320.22 | 0.931 | 1.700 | 249.9 | 62,397.4 | 0.892 | 1.628 | 237.1 |
| 11 | 71,894.1 | 0.998 | 1.670 | 150.3 | 71,495.9 | 0.993 | 1.661 | 278.9 | 72,259.23 | 1.003 | 1.678 | 259.9 | 68,575.1 | 0.954 | 1.593 | 248.9 |
| 12 | 75,222.7 | 0.906 | 1.665 | 156.7 | 74,771.6 | 0.901 | 1.655 | 289.4 | 75,636.18 | 0.910 | 1.674 | 269.7 | 71,463.7 | 0.863 | 1.584 | 257.4 |
| 13 | 80,984.0 | 0.913 | 1.687 | 161.9 | 80,540.7 | 0.908 | 1.678 | 299.6 | 81,390.43 | 0.917 | 1.695 | 279.2 | 77,289.6 | 0.874 | 1.613 | 268.6 |
| 14 | 89,048.8 | 0.962 | 1.703 | 167.5 | 88,522.5 | 0.957 | 1.693 | 306.5 | 89,531.16 | 0.967 | 1.712 | 285.7 | 84,663.2 | 0.918 | 1.622 | 280.5 |
| 15 | 95,503.5 | 0.954 | 1.684 | 176.8 | 94,876.3 | 0.948 | 1.674 | 325.7 | 96,078.48 | 0.960 | 1.694 | 303.6 | 90,276.5 | 0.906 | 1.597 | 292.7 |
Table 7.
The values of RPDs for each algorithm
| Problem | SA-GP | GA-GP | PSO-GP | HSAMCGP | ||||||||
|---|---|---|---|---|---|---|---|---|---|---|---|---|
| RPD1 | RPD2 | RPD3 | RPD1 | RPD2 | RPD3 | RPD1 | RPD2 | RPD3 | RPD1 | RPD2 | RPD3 | |
| 1 | 1.21 | 1.12 | 1.20 | 1.06 | 0.99 | 1.06 | 1.34 | 1.24 | 1.33 | 0 | 0 | 0 |
| 2 | 1.85 | 1.57 | 1.35 | 1.63 | 1.38 | 1.19 | 2.05 | 1.74 | 1.50 | 0 | 0 | 0 |
| 3 | 2.43 | 1.93 | 2.13 | 2.14 | 1.70 | 1.87 | 2.70 | 2.14 | 2.36 | 0 | 0 | 0 |
| 4 | 2.28 | 1.70 | 2.10 | 2.01 | 1.50 | 1.85 | 2.53 | 1.89 | 2.33 | 0 | 0 | 0 |
| 5 | 3.51 | 3.14 | 3.35 | 3.09 | 2.76 | 2.95 | 3.90 | 3.49 | 3.72 | 0 | 0 | 0 |
| 6 | 3.24 | 3.00 | 3.18 | 2.85 | 2.64 | 2.80 | 3.60 | 3.33 | 3.53 | 0 | 0 | 0 |
| 7 | 4.12 | 3.61 | 3.83 | 3.63 | 3.18 | 3.37 | 4.57 | 4.01 | 4.25 | 0 | 0 | 0 |
| 8 | 3.93 | 3.55 | 3.74 | 3.46 | 3.12 | 3.29 | 4.36 | 3.94 | 4.15 | 0 | 0 | 0 |
| 9 | 4.50 | 4.18 | 4.36 | 3.96 | 3.68 | 3.84 | 5.00 | 4.64 | 4.84 | 0 | 0 | 0 |
| 10 | 4.22 | 3.96 | 4.00 | 3.71 | 3.48 | 3.52 | 4.68 | 4.40 | 4.44 | 0 | 0 | 0 |
| 11 | 4.84 | 4.61 | 4.82 | 4.26 | 4.06 | 4.24 | 5.37 | 5.12 | 5.35 | 0 | 0 | 0 |
| 12 | 5.26 | 4.95 | 5.11 | 4.63 | 4.36 | 4.50 | 5.84 | 5.49 | 5.67 | 0 | 0 | 0 |
| 13 | 4.78 | 4.43 | 4.57 | 4.21 | 3.90 | 4.02 | 5.31 | 4.92 | 5.07 | 0 | 0 | 0 |
| 14 | 5.18 | 4.84 | 5.00 | 4.56 | 4.26 | 4.40 | 5.75 | 5.37 | 5.55 | 0 | 0 | 0 |
| 15 | 5.79 | 5.32 | 5.46 | 5.10 | 4.68 | 4.80 | 6.43 | 5.91 | 6.06 | 0 | 0 | 0 |
| Average | 3.63 | 3.19 | 4.03 | 0 | ||||||||
As shown in Table 7, based on the CPU time metric, the performance of the SA algorithm is the best (see Fig. 11). According to Table 7, the developed HSAMCGP algorithm has the best performance based on the RPD metric. The results demonstrate that in all instances, the value of RPD is equal to zero for the HSAMCGP method, which shows the high capability of this algorithm to obtain high-quality solutions. For the statistical validation, we have conducted an ANOVA test and presented the least significant deviation (LSD) chart for the RPD metric (see Fig. 12). Based on this figure, the performance of the proposed HSAMCGP method is significantly better than the other algorithms in terms of solutions’ quality.
Fig. 11.

The comparison of the algorithm according to the CPU time metric
Fig. 12.
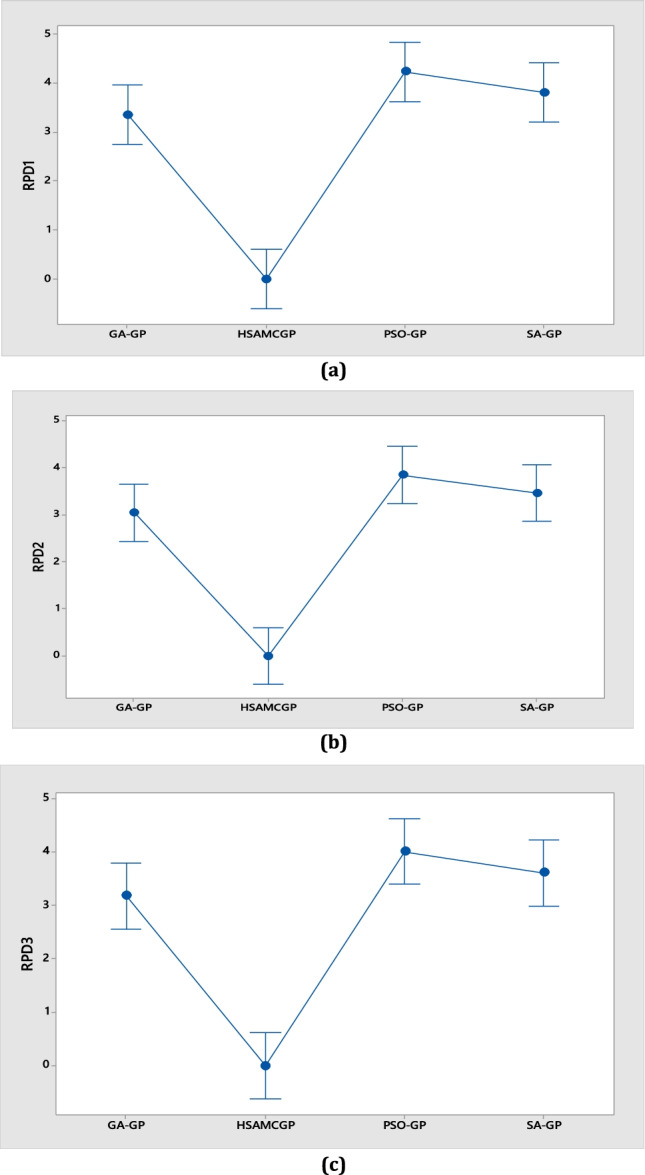
The LSD chart based on the RPD metric
Sensitivity analysis
This section aims to conduct several sensitivity analyses to study the behavior of the research problem according to changing the crucial parameters.
Demand
To examine the influence of the demand size on the research problem, we solve the offered model under different values for the demand parameter and report the obtained results (see Fig. 13). The achieved results indicate the following points:
An increase in the demand sizes has led to increasing the total costs. The main reason for this behavior is that an enhancement of the demand results in establishing more facilities, producing and distributing more goods, and more transportation activities that significantly increase the total cost.
By enhancing the demand size, the environmental impact increases, too. In this regard, a 30% increase in the demand size from its base case leads to a 35% increase in carbon emissions. The main reason for this behavior is that increasing the demand parameter enhances the production, transportation, repair, and recycling activities. So, the mentioned activities generate more carbon emissions in the SC network.
The obtained results demonstrate the positive effect of enhancing the demand parameter on the social impacts. In this way, enhancement of the demand leads to increasing the social impacts. For example, when the demand size increases by 30%, the social impacts increase around 8%.
Fig. 13 shows that increasing the demand has led to a decrease in the service level and visibility of the SC. This behavior demonstrates the negative impact of enhancing the demand size on the visibility and responsiveness measures. For example, when the quantity of the demand has increased from − 30 to + 30%, the service level decreases from 0.973 to 0.902.
Fig. 13.

The behavior of the research problem according to changing the demand
Capacity
In this section, the influence of the capacity parameter on the outputs is investigated. Figure 14 illustrates the behavior of the research problem according to changing the capacity parameter. The obtained results show the following points:
By increasing the value of the capacity parameter, the first objective function (total cost) has significantly decreased. The main reason for this behavior is that increasing the capacity results in opening fewer facilities leading to decreasing the establishment costs and subsequently the total cost.
Enhancing the capacity of the facilities has led to a decrease in environmental damages, which shows the positive impact of increasing the capacity on the environmental impacts. In this regard, by 30% increasing the amount of the capacity from its base case, the environmental impacts decreased by 19%. On the other hand, the obtained results show that increasing the capacity has reduced the social impacts. The main reason for this behavior is that by increasing the capacity parameter, the number of opened facilities decreases, and thus the number of job opportunities (i.e., the social factor) has reduced.
The achieved results demonstrate that the change of the capacity parameter has no effect on the visibility metric but has increased the service level. In this regard, by increasing the amount of the mentioned parameters from − 30 to + 30%, the quantity of the service level increases from 0.907 to 0.962.
Fig. 14.

The behavior of the research problem according to changing the capacity
Managerial insights
In this section, the main managerial implications of the present work are presented. This research has tried to propose a mathematical model to configure the medical devices supply chain by considering information-sharing systems and sustainability. In this way, this paper can help logistics managers and supply chain leaders in the medical devices industry identify the concept of sustainability and its dimensions. On the other side, this work has demonstrated the importance and potential of employing information-sharing systems in the logistics area to managers. The results of the current work can be utilized to improve the productivity of supply chain networks, especially in the case of medical devices. In this regard, the achieved outputs demonstrated that by enhancing the demand size, the environmental impact increases, too. To prevent this negative behavior, managers can adopt some strategies, such as employing technologies with lower emissions. The managers should know that although using green technologies may increase the costs of the system, it can provide a green image from the firm that increases the customers’ loyalty and also enhances the profits in long term. Also, the outputs of the sensitivity analysis showed that the capacity has a negative impact on the costs of the system. The managers can adopt some efficient strategies, such as outsourcing.
Conclusions
The current study addressed the SC network design problem considering sustainability concepts and information-sharing systems for the medical devices industry. In this regard, a multi-objective mathematical model was suggested to minimize the total costs and environmental impacts, and maximize the service level, visibility, and social impacts. Afterward, due to the complexity of the research problem, a hybrid solution method was developed to solve the offered model. The results demonstrated that the developed hybrid algorithm could efficiently solve the suggested model and achieve high-quality solutions. Also, based on the results, increasing the demand parameter has increased environmental damages, service level, and the total cost, however, has improved the social impacts. On the other side, according to the sensitivity analysis, enhancing the capacity parameter has decreased the social impacts, environmental damages, and the total cost but has increased the service level. Similar to other papers, the current work has some limitations, too. For example, the proposed model is single-product and single-period and provides an optimal plan only for one period. In this regard, future studies can extend the current model to a multi-product and multi-period one. On the other hand, this work did not consider the uncertainty of the parameters. Since uncertainty is known as one of the major issues in supply chain management, future studies can investigate the current research under uncertainty and employ approaches, such as stochastic programming or robust optimization to deal with uncertainty. Finally, future researchers can combine the developed heuristic method with the exact methods such as benders decomposition to solve the research problem.
Author contribution
Farid Taheri: conceptualization, methodology, validation. Babak Farhang Moghaddam: visualization, software, manuscript preparation.
Data availability
Not applicable.
Declarations
Ethics approval and consent to participate
Not applicable.
Consent for publication
Not applicable.
Competing interests
The author declares no competing interests.
Footnotes
Publisher's note
Springer Nature remains neutral with regard to jurisdictional claims in published maps and institutional affiliations.
References
- Afrasiabi A, Tavana M, Di Caprio D (2022) An extended hybrid fuzzy multi-criteria decision model for sustainable and resilient supplier selection. Environ Sci Pollut Res 1–24 [DOI] [PMC free article] [PubMed]
- Akbari-Kasgari M, Khademi-Zare H, Fakhrzad MB, et al. (2022) Designing a resilient and sustainable closed-loop supply chain network in copper industry. Clean Technol Environ Policy 1–28
- Alamroshan F, La’li M, Yahyaei M. The green-agile supplier selection problem for the medical devices: a hybrid fuzzy decision-making approach. Environ Sci Pollut Res. 2022;29:6793–6811. doi: 10.1007/s11356-021-14690-z. [DOI] [PMC free article] [PubMed] [Google Scholar]
- Amin SH, Baki F. A facility location model for global closed-loop supply chain network design. Appl Math Model. 2017;41:316–330. doi: 10.1016/j.apm.2016.08.030. [DOI] [Google Scholar]
- Asadi Z, Khatir MV, Rahimi M (2022) Robust design of a green-responsive closed-loop supply chain network for the ventilator device. Environ Sci Pollut Res 1–21 [DOI] [PMC free article] [PubMed]
- Babaee Tirkolaee E, Aydın NS. A sustainable medical waste collection and transportation model for pandemics. Waste Manag Res. 2021 doi: 10.1177/0734242X211000437. [DOI] [PubMed] [Google Scholar]
- Babaeinesami A, Tohidi H, Ghasemi P, et al. (2022) A closed-loop supply chain configuration considering environmental impacts: a self-adaptive NSGA-II algorithm. Appl Intell 1–19
- Behzadianfar M, Eydi A, Shahrokhi M. A sustainable closed loop supply chain design problem in intuitionistic fuzzy environment for dairy products. Soft Comput. 2022;26:1417–1435. doi: 10.1007/s00500-021-06409-6. [DOI] [Google Scholar]
- Chang CT. Multi-choice goal programming with utility functions. Eur J Oper Res. 2011;215:439–445. doi: 10.1016/j.ejor.2011.06.041. [DOI] [Google Scholar]
- Cheraghalipour A, Farsad S. A bi-objective sustainable supplier selection and order allocation considering quantity discounts under disruption risks: a case study in plastic industry. Comput Ind Eng. 2018;118:237–250. doi: 10.1016/j.cie.2018.02.041. [DOI] [Google Scholar]
- de Sousa Jabbour ABL, Jabbour CJC, Godinho Filho M, Roubaud D. Industry 4.0 and the circular economy: a proposed research agenda and original roadmap for sustainable operations. Ann Oper Res. 2018;270:273–286. doi: 10.1007/s10479-018-2772-8. [DOI] [Google Scholar]
- Devika K, Jafarian A, Nourbakhsh V. Designing a sustainable closed-loop supply chain network based on triple bottom line approach: a comparison of metaheuristics hybridization techniques. Eur J Oper Res. 2014;235:594–615. doi: 10.1016/j.ejor.2013.12.032. [DOI] [Google Scholar]
- Fallahpour A, Nayeri S, Sheikhalishahi M, et al. (2021a) A hyper-hybrid fuzzy decision-making framework for the sustainable-resilient supplier selection problem: a case study of Malaysian Palm oil industry. Environ Sci Pollut Res 1–21 [DOI] [PMC free article] [PubMed]
- Fallahpour A, Wong KY, Rajoo S, et al. (2021b) An integrated approach for a sustainable supplier selection based on Industry 4.0 concept. Environ Sci Pollut Res 1–19 [DOI] [PubMed]
- Ghasemi P, Goodarzian F, Gunasekaran A, Abraham A (2021) A bi-level mathematical model for logistic management considering the evolutionary game with environmental feedbacks. Int J Logist Manag
- Gholizadeh H, Jahani H, Abareshi A, Goh M. Sustainable closed-loop supply chain for dairy industry with robust and heuristic optimization. Comput Ind Eng. 2021;157:107324. doi: 10.1016/j.cie.2021.107324. [DOI] [Google Scholar]
- Golpîra H, Javanmardan A (2022) Robust optimization of sustainable closed-loop supply chain considering carbon emission schemes. Sustain Prod Consum
- Gonul Kochan C, Nowicki DR, Sauser B, Randall WS. Impact of cloud-based information sharing on hospital supply chain performance: a system dynamics framework. Int J Prod Econ. 2018;195:168–185. doi: 10.1016/j.ijpe.2017.10.008. [DOI] [Google Scholar]
- Goodarzian F, Ghasemi P, Gunasekaren A, et al. (2021a) A sustainable-resilience healthcare network for handling COVID-19 pandemic. Ann Oper Res 1–65 [DOI] [PMC free article] [PubMed]
- Goodarzian F, Navaei A, Ehsani B, et al. (2022) Designing an integrated responsive-green-cold vaccine supply chain network using Internet-of-Things: artificial intelligence-based solutions. Ann Oper Res 1–45 [DOI] [PMC free article] [PubMed]
- Goodarzian F, Taleizadeh AA, Ghasemi P, Abraham A. An integrated sustainable medical supply chain network during COVID-19. Eng Appl Artif Intell. 2021;100:104188. doi: 10.1016/j.engappai.2021.104188. [DOI] [PMC free article] [PubMed] [Google Scholar]
- Govindan1a K, Mina H, Esmaeili A, Gholami-Zanjani SM (2019) An integrated hybrid approach for designing a green closed-loop supply chain network under uncertainty
- Hajiaghaei-Keshteli M, Fard AMF. Sustainable closed-loop supply chain network design with discount supposition. Neural Comput Appl. 2019;31:5343–5377. doi: 10.1007/s00521-018-3369-5. [DOI] [Google Scholar]
- Homayouni Z, Pishvaee MS, Jahani H, Ivanov D (2021) A robust-heuristic optimization approach to a green supply chain design with consideration of assorted vehicle types and carbon policies under uncertainty. Ann Oper Res 1–41
- Huo B, Haq MZU, Gu M. The impact of information sharing on supply chain learning and flexibility performance. Int J Prod Res. 2021;59:1411–1434. doi: 10.1080/00207543.2020.1824082. [DOI] [Google Scholar]
- Ing SH, Jamin NF, Karunaniti T, et al. (2021) Development of portable oxygen concentrator device for COVID-19 patient. 2:220–223
- Kaur H, Singh SP. Heuristic modeling for sustainable procurement and logistics in a supply chain using big data. Comput Oper Res. 2018;98:301–321. doi: 10.1016/j.cor.2017.05.008. [DOI] [Google Scholar]
- Khalili-Damghani K, Tavana M, Ghasemi P. A stochastic bi-objective simulation–optimization model for cascade disaster location-allocation-distribution problems. Ann Oper Res. 2022;309:103–141. doi: 10.1007/s10479-021-04191-0. [DOI] [Google Scholar]
- Khorshidvand B, Soleimani H, Sibdari S, Esfahani MMS. Developing a two-stage model for a sustainable closed-loop supply chain with pricing and advertising decisions. J Clean Prod. 2021;309:127165. doi: 10.1016/j.jclepro.2021.127165. [DOI] [Google Scholar]
- Kirkpatrick S, Gelatt CD, Vecchi MP. Optimization by simulated annealing. Science (80-) 1983;220:671–680. doi: 10.1126/science.220.4598.671. [DOI] [PubMed] [Google Scholar]
- Kumar P, Singh RK (2021) Application of Industry 4.0 technologies for effective coordination in humanitarian supply chains: a strategic approach. Ann Oper Res 1–33 [DOI] [PMC free article] [PubMed]
- Mahata GC, De SK, Bhattacharya K, Maity S (2021) Three-echelon supply chain model in an imperfect production system with inspection error, learning effect, and return policy under fuzzy environment. Int J Syst Sci Oper Logist 1–21
- Mamashli Z, Bozorgi-Amiri A, Dadashpour I, et al. (2021a) A heuristic-based multi-choice goal programming for the stochastic sustainable-resilient routing-allocation problem in relief logistics. Neural Comput Appl 1–27
- Mamashli Z, Nayeri S, Tavakkoli-Moghaddam R, et al. Designing a sustainable–resilient disaster waste management system under hybrid uncertainty: a case study. Eng Appl Artif Intell. 2021;106:104459. doi: 10.1016/j.engappai.2021.104459. [DOI] [Google Scholar]
- Mardani A, Kannan D, Hooker RE, et al. Evaluation of green and sustainable supply chain management using structural equation modelling: a systematic review of the state of the art literature and recommendations for future research. J Clean Prod. 2020;249:119383. doi: 10.1016/j.jclepro.2019.119383. [DOI] [Google Scholar]
- Mehrjerdi YZ, Shafiee M (2020) A resilient and sustainable closed-loop supply chain using multiple sourcing and information sharing strategies. J Clean Prod 125141
- Mehrjerdi YZ, Shafiee M. A resilient and sustainable closed-loop supply chain using multiple sourcing and information sharing strategies. J Clean Prod. 2021;289:125141. doi: 10.1016/j.jclepro.2020.125141. [DOI] [Google Scholar]
- Moheb-Alizadeh H, Handfield R, Warsing D. Efficient and sustainable closed-loop supply chain network design: a two-stage stochastic formulation with a hybrid solution methodology. J Clean Prod. 2021;308:127323. doi: 10.1016/j.jclepro.2021.127323. [DOI] [Google Scholar]
- Mota B, Gomes MI, Carvalho A, Barbosa-Povoa AP. Sustainable supply chains: An integrated modeling approach under uncertainty. Omega. 2018;77:32–57. doi: 10.1016/j.omega.2017.05.006. [DOI] [Google Scholar]
- Nabila AW, Mahendrawathi ER, Chen JC, Chen TL. The impact analysis of information technology alignment for information sharing and supply chain integration on customer responsiveness. Procedia Comput Sci. 2021;197:718–726. doi: 10.1016/j.procs.2021.12.193. [DOI] [Google Scholar]
- Navazi F, Sazvar Z, Tavakkoli-Moghaddam R (2021) A sustainable closed-loop location-routing-inventory problem for perishable products. Sci Iran
- Nayeri S, Asadi-Gangraj E, Emami S. Goal programming-based post-disaster decision making for allocation and scheduling the rescue units in natural disaster with time-window. Int J Ind Eng Prod Res. 2018;29:65–78. [Google Scholar]
- Nayeri S, Paydar MM, Asadi-Gangraj E, Emami S (2020) Multi-objective fuzzy robust optimization approach to sustainable closed-loop supply chain network design. Comput Ind Eng 106716
- Nayeri S, Sazvar Z, Heydari J (2022) A global-responsive supply chain considering sustainability and resiliency: application in the medical devices industry. Socioecon Plann Sci 101303
- Nayeri S, Torabi SA, Tavakoli M, Sazvar Z (2021) A multi-objective fuzzy robust stochastic model for designing a sustainable-resilient-responsive supply chain network. J Clean Prod 127691
- Panahifar F, Byrne PJ, Salam MA, Heavey C. Supply chain collaboration and firm’s performance: the critical role of information sharing and trust. J Enterp Inf Manag. 2018;31:358–379. doi: 10.1108/JEIM-08-2017-0114. [DOI] [Google Scholar]
- Pedram A, Bin YN, Udoncy OE, et al. Integrated forward and reverse supply chain: a tire case study. Waste Manag. 2017;60:460–470. doi: 10.1016/j.wasman.2016.06.029. [DOI] [PubMed] [Google Scholar]
- Pishvaee MS, Razmi J, Torabi SA. An accelerated Benders decomposition algorithm for sustainable supply chain network design under uncertainty: a case study of medical needle and syringe supply chain. Transp Res Part E Logist Transp Rev. 2014;67:14–38. doi: 10.1016/j.tre.2014.04.001. [DOI] [Google Scholar]
- Pourjavad E, Mayorga RV. Optimization of a sustainable closed loop supply chain network design under uncertainty using multi-objective evolutionary algorithms. Adv Prod Eng Manag. 2018;13:216–228. [Google Scholar]
- Rabbani M, Hosseini-Mokhallesun SAA, Ordibazar AH, Farrokhi-Asl H. A hybrid robust possibilistic approach for a sustainable supply chain location-allocation network design. Int J Syst Sci Oper Logist. 2020;7:60–75. [Google Scholar]
- Razavi N, Gholizadeh H, Nayeria S, Ashrafi TA (2020) A robust optimization model of the field hospitals in the sustainable blood supply chain in crisis logistics. J Oper Res Soc 1–26
- Rostami A, Paydar MM, Asadi-Gangraj E (2020) A hybrid genetic algorithm for integrating virtual cellular manufacturing with supply chain management considering new product development. Elsevier
- Sabouhi F, Jabalameli MS, Jabbarzadeh A, Fahimnia B (2020) A multi-cut L-shaped method for resilient and responsive supply chain network design. Int J Prod Res 1–29
- Safaei S, Ghasemi P, Goodarzian F, Momenitabar M (2022) Designing a new multi-echelon multi-period closed-loop supply chain network by forecasting demand using time series model: a genetic algorithm. Environ Sci Pollut Res 1–15 [DOI] [PubMed]
- Salehi-Amiri A, Zahedi A, Akbapour N, Hajiaghaei-Keshteli M. Designing a sustainable closed-loop supply chain network for walnut industry. Renew Sustain Energy Rev. 2021;141:110821. doi: 10.1016/j.rser.2021.110821. [DOI] [Google Scholar]
- Sazvar Z, Tafakkori K, Oladzad N, Nayeri S (2021a) A capacity planning approach for sustainable-resilient supply chain network design under uncertainty: a case study of vaccine supply chain. Comput Ind Eng 107406
- Sazvar Z, Zokaee M, Tavakkoli-Moghaddam R, et al. (2021b) Designing a sustainable closed-loop pharmaceutical supply chain in a competitive market considering demand uncertainty, manufacturer’s brand and waste management. Ann Oper Res 1–32 [DOI] [PMC free article] [PubMed]
- Shafiee F, Kazemi A, Caghooshi AJ, et al. (2021) A robust multi-objective optimization model for inventory and production management with environmental and social consideration: a real case of dairy industry. J Clean Prod 126230
- Shafipour-omran B, Khalili-Damghani K, Ghasemi P. Solving a supply chain problem using two approaches of fuzzy goal programming based on TOPSIS and fuzzy preference relations. J Ind Syst Eng. 2020;13:27–48. [Google Scholar]
- Sherafati M, Bashiri M, Tavakkoli-Moghaddam R, Pishvaee MS. Supply chain network design considering sustainable development paradigm: a case study in cable industry. J Clean Prod. 2019;234:366–380. doi: 10.1016/j.jclepro.2019.06.095. [DOI] [Google Scholar]
- Shirazi H, Kia R, Ghasemi P. A stochastic bi-objective simulation–optimization model for plasma supply chain in case of COVID-19 outbreak. Appl Soft Comput. 2021;112:107725. doi: 10.1016/j.asoc.2021.107725. [DOI] [PMC free article] [PubMed] [Google Scholar]
- Shirazi H, Kia R, Ghasemi P. Ranking of hospitals in the case of COVID-19 outbreak: a new integrated approach using patient satisfaction criteria. Int J Healthc Manag. 2020;13:312–324. doi: 10.1080/20479700.2020.1803622. [DOI] [Google Scholar]
- Soleimani H, Govindan K, Saghafi H, Jafari H. Fuzzy multi-objective sustainable and green closed-loop supply chain network design. Comput Ind Eng. 2017;109:191–203. doi: 10.1016/j.cie.2017.04.038. [DOI] [Google Scholar]
- Tavana M, Kian H, Nasr AK, et al. (2022) A comprehensive framework for sustainable closed-loop supply chain network design. J Clean Prod 129777. 10.1016/j.jclepro.2021.129777
- Thakur S, Mahato DP (2022) IoT based delivery system for demand and supply chain of oxygen concentrators. In: 2022 14th International Conference on COMmunication Systems & NETworkS (COMSNETS). IEEE, pp 418–420
- Tirkolaee EB, Abbasian P, Weber G-W. Sustainable fuzzy multi-trip location-routing problem for medical waste management during the COVID-19 outbreak. Sci Total Environ. 2021;756:143607. doi: 10.1016/j.scitotenv.2020.143607. [DOI] [PMC free article] [PubMed] [Google Scholar]
- Tirkolaee EB, Goli A, Ghasemi P, Goodarzian F. Designing a sustainable closed-loop supply chain network of face masks during the COVID-19 pandemic: Pareto-based algorithms J. Clean Prod. 2022;333:130056. doi: 10.1016/j.jclepro.2021.130056. [DOI] [PMC free article] [PubMed] [Google Scholar]
- Tirkolaee EB, Goli A, Gütmen S, et al. (2022b) A novel model for sustainable waste collection arc routing problem: Pareto-based algorithms. Ann Oper Res 1–26 [DOI] [PMC free article] [PubMed]
- Tirkolaee EB, Sadeghi S, Mooseloo FM, et al. (2021b) Application of machine learning in supply chain management: a comprehensive overview of the main areas. Math Probl Eng 2021b:
- Vahdani M, Sazvar Z. Coordinated inventory control and pricing policies for online retailers with perishable products in the presence of social learning. Comput Ind Eng. 2022;168:108093. doi: 10.1016/j.cie.2022.108093. [DOI] [Google Scholar]
- Yuliana OY, Purwanto GR, Siagian H (2022) The effect of information technology implementation on supply chain performance through information sharing and supply chain collaboration. Curr Appl Sci Technol 14-pages
- Zarrat Dakhely Parast Z, Haleh H, Avakh Darestani S, Amin-Tahmasbi H (2021) Green reverse supply chain network design considering location-routing-inventory decisions with simultaneous pickup and delivery. Environ Sci Pollut Res 1–22 [DOI] [PubMed]
- Zhalechian M, Tavakkoli-Moghaddam R, Zahiri B, Mohammadi M. Sustainable design of a closed-loop location-routing-inventory supply chain network under mixed uncertainty. Transp Res Part E Logist Transp Rev. 2016;89:182–214. doi: 10.1016/j.tre.2016.02.011. [DOI] [Google Scholar]
- Zhang F, Gong Z (2021) Supply chain inventory collaborative management and information sharing mechanism based on cloud computing and 5G internet of things. Math Probl Eng 202110.1155/2021/6670718
- Zhang Y, Wang Y, Yadav BK (2022) Application of circular economy and uncertainty planning in analyzing the sustainable closed-loop supply chain network design. 2022:
Associated Data
This section collects any data citations, data availability statements, or supplementary materials included in this article.
Data Availability Statement
Not applicable.