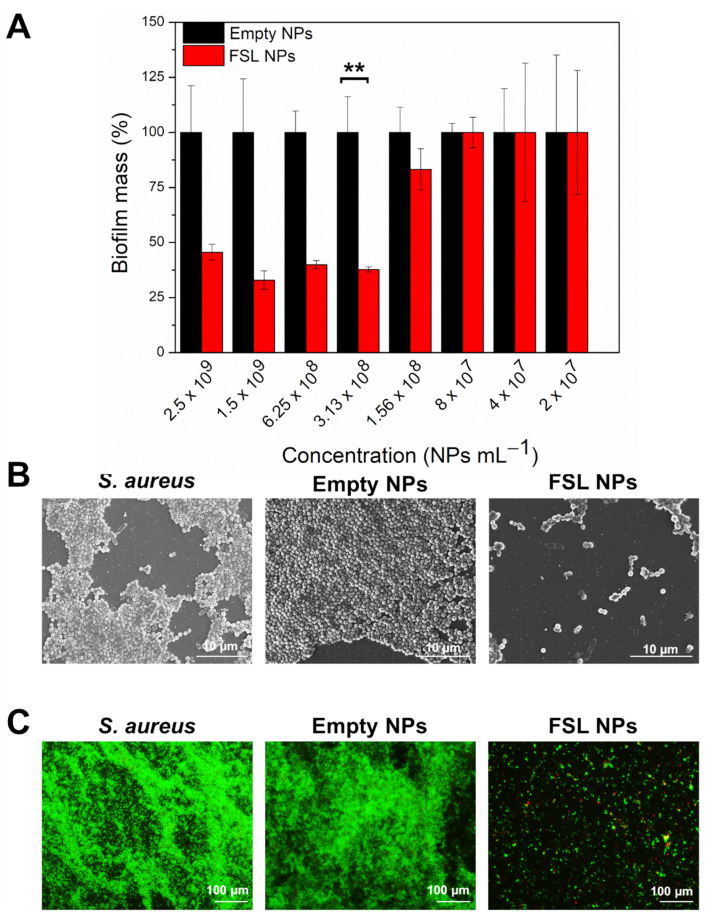
Figure 5.
Elimination of S. aureus biofilm grown for 24 h. (A) Total biofilm quantification using crystal violet assay after treatment with increasing concentration of empty and FSL NPs. (B) SEM images of biofilm treated with 3.13 × 10⁸ NPs mL−1 empty and FSL NPs. (C) LIVE/DEAD BacLight kit microscopic visualization of biofilm treated with 3.13 × 10⁸ NPs mL−1 empty and FSL NPs. The green and red fluorescence images are overlaid. The dead bacteria are stained in red and live bacteria are stained in green. Stars represent the statistical differences between the biofilm reduction potential of FSL NPs at the lowest concentration able to reduce the mature biofilm and empty NPs (p < 0.001).

