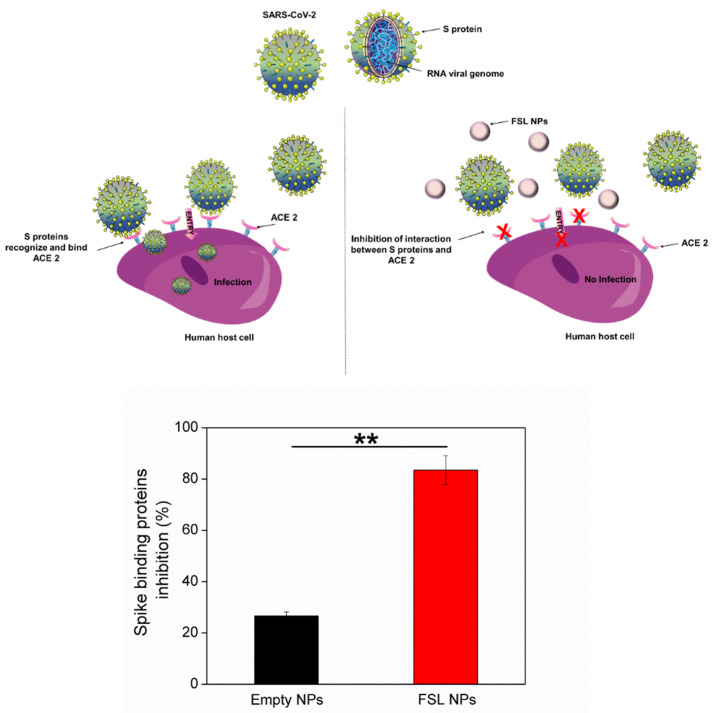
Figure 6.
Schematic representation of interaction between the spike-binding proteins of SARS-CoV-2 and the ACE2 receptor on the host cell, and its inhibition after exposure to empty and FSL NPs. Parts of the figure were created using templates from Servier Medical Art (smart.servier.com (accessed on 18 June 2022)). Stars represent the statistical differences between empty and FSL NP inhibition of the spike protein binding interaction and the ACE2 receptor (p < 0.001).

