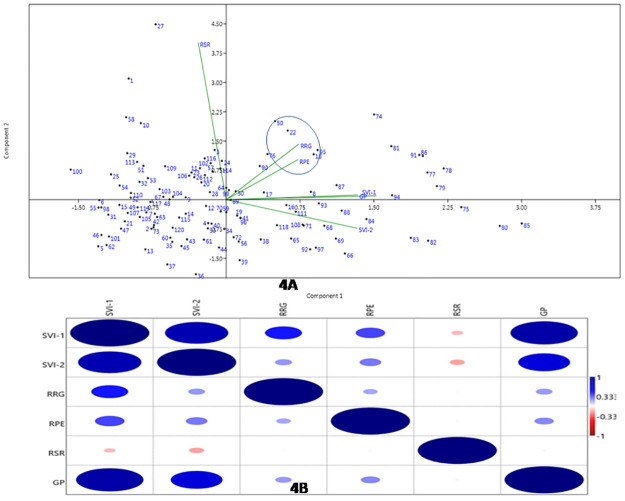
Fig 4. (A) Genotype-by-trait bi-plot diagram showing 120rice landraces in two PCs for 6 physiological traits (B) Heat map showing Pearson’s correlation coefficients for physiological traits. The dot numbers in the diagram depict the serial number of the germplasm line listed in Table 1.
Significant correlations are colored either in red (negative correlation at 0.01 level) or blue hues (positive correlation at 0.01 level).

