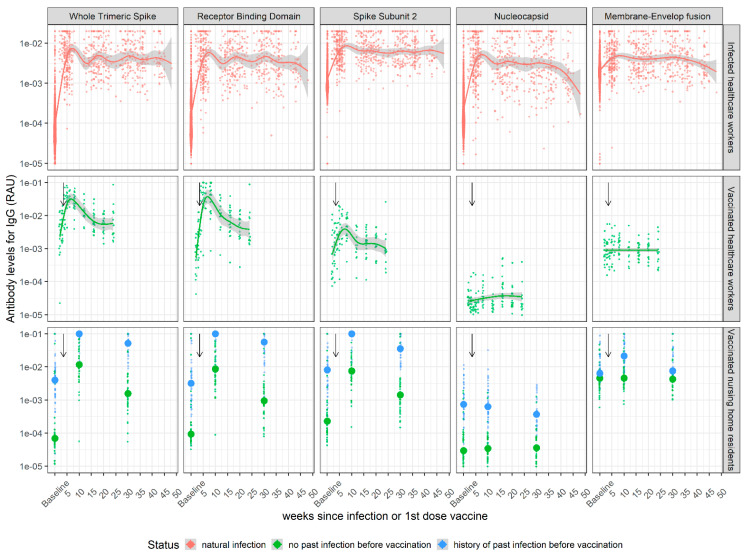
Figure 1.
IgG antibody kinetics following SARS-CoV-2 infection or vaccination with BNT162b2. IgG antibodies to five SARS-CoV-2 antigens were measured in serum samples using a bead-based multiplex Luminex assay. (First row) Healthcare workers from hospitals in Strasbourg and Paris were followed longitudinally after PCR-confirmed SARS-CoV-2 infection. (Middle row) Healthcare workers from a hospital in Orléans were followed longitudinally after receiving two doses of Pfizer BNT162b2 vaccine. (Bottom row) Residents of a nursing home in Dublin were followed after receiving two doses of Pfizer BNT162b2 vaccine. Individuals with “history of past infection” correspond to individuals with recorded SARS-CoV-2 infection before vaccination and are represented with blue dots. Individuals with no history of past infection are in green. Time is denoted as weeks post-vaccination. Thicker dots represent the median of each group. Black arrows indicate the date of the second vaccine injection.

