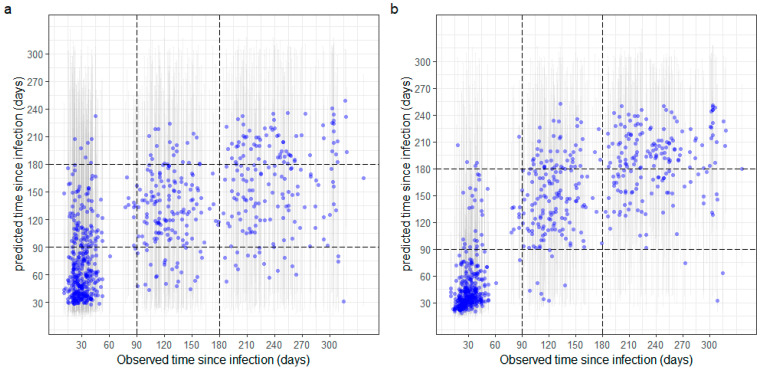
Figure 4.
Predictions of time since infection without (a) and with (b) avidity measurements. Predictions are derived from random forest regression models, with point estimates in blue and 95% uncertainty intervals as vertical bars. (a) Predictions without avidity measurements from a random forest model with 6 biomarkers: NP IgA, S IgA, NP IgG, S2 IgA, RBD IgA and S2 IgG. (b) Predictions with avidity measurements from a random forest model with 6 biomarkers: NP avidity, NP IgA, NP IgG, S avidity, RBD avidity and S2 avidity.

