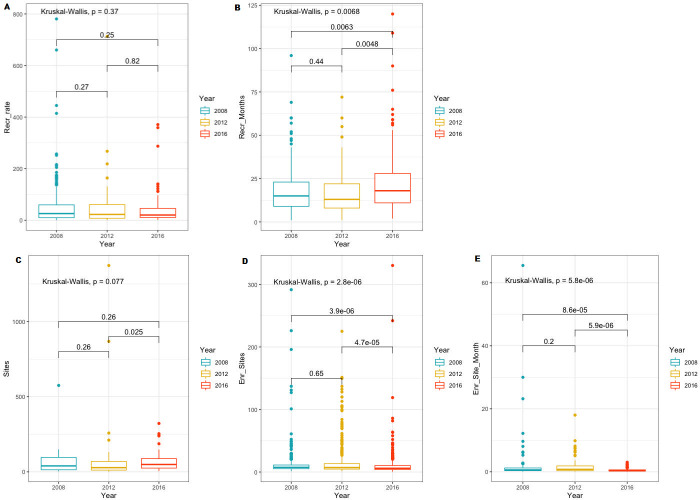
Fig 3.
Comparison of key recruitment metrics across the three time periods from 2008–2019 (A: Comparison of recruitment rate (mean, IQR), B: Comparison of recruitment duration in months (mean, IQR), C: Comparison of the number of sites (mean, IQR), D: Comparison of the number of participants enrolled per site (mean, IQR), E: Comparison of the number of participants enrolled per site per month (mean, IQR)).

