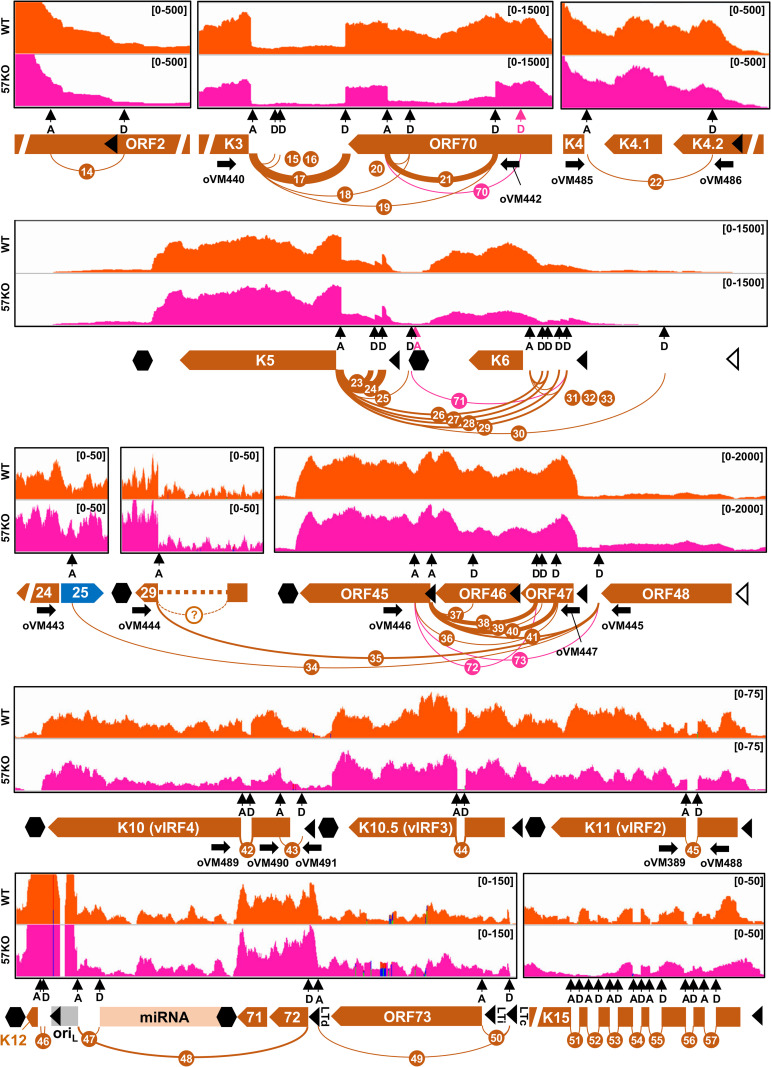
Fig 4. Mapping of KSHV RNA splice junctions from the minus strand of viral genome.
The diagrams depicting all splice junctions (colored arches) with ≥10 supporting splice reads mapped to viral transcripts expressed from the minus strand of the KSHV genome, with the splicing events being numbered in the order from the genome 5′ to 3′ direction. The numbered orange arches represent splice junctions detected from the WT genome and pink arches from the 57KO genome in the cells (see Tables 1 and 3). The arch thickness represents a relative abundance of detected splice junction reads. The RNA-seq reads-coverage from one representative sample from the WT and 57KO genome in the cells with lytic infection is shown above the arches, with the reads-coverage depth shown in the upper right corner. See other details in Fig 3. LTc—constitutive latent promoter, LTi—inducible latent promoter, LTd—distal latent promoter, oriL—lytic origin of replication.

