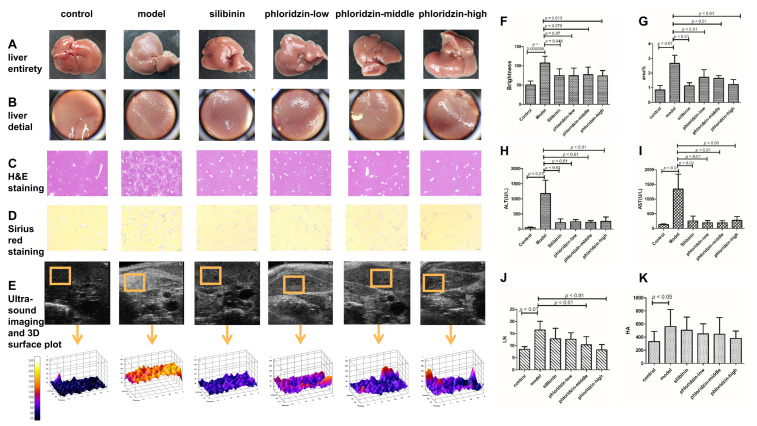
Figure 2.
Pharmacodynamic results of phloridzin in the treatment of liver fibrosis. (A) Representative photos of liver appearance in each group. (B) Detailed view of liver appearance in each group. (C) Histological images of liver in each group after H&E stain. (D) Histological images of liver in each group after Sirius red stain. (E) Representative in vivo ultrasound imaging of livers from different groups. Fibrosis improvement can be seen by a decreased intensity in hepatic echogenicity. The 3D surface plots of the ultrasound images within the orange-lined squares correspond to the echogenic uniformity in the liver. (F) Statistics of the liver brightness of each group shows that compared with the model group, each treatment group has different degrees of reduction. Among them, the results of the silibinin treatment group and the high-dose phloridzin group are significantly different. (G) Percentage of area occupied by fibers in Sirius red-stained sections of liver in each group. (H,I) AST and ALT levels of each group were detected. (J,K) LN and HA levels of each group were detected by ELISA.

