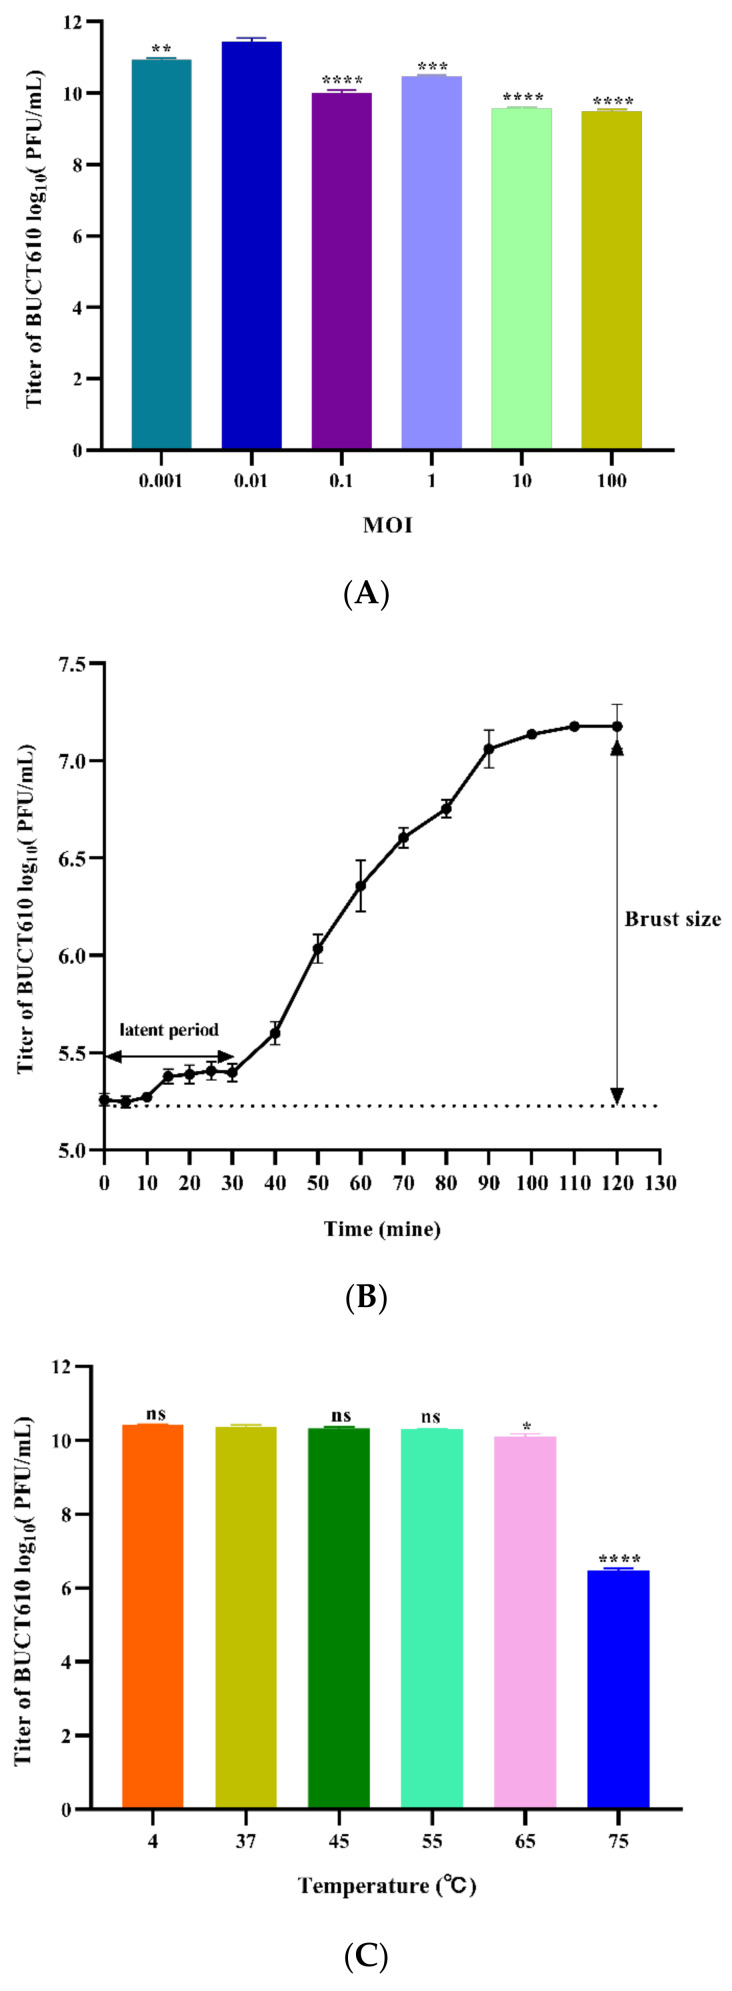
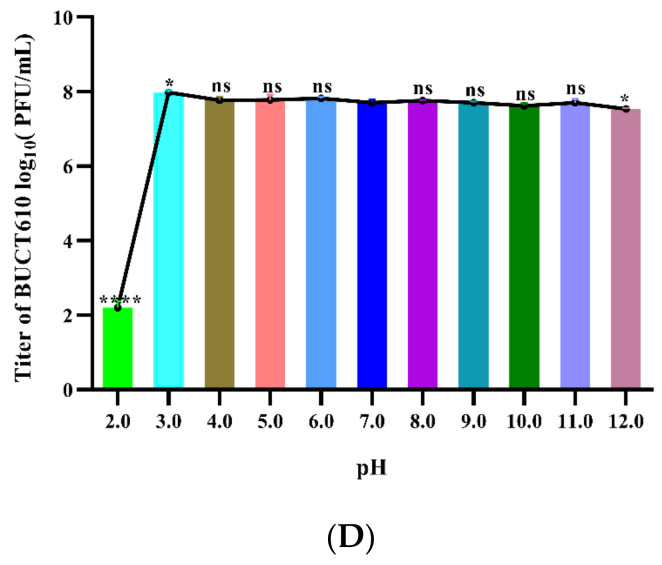
Figure 2.
Physiological characterization of phage BUCT610. (A) Optimal MOI assays of bacteriophage BUCT610. (B) One-step growth curve of bacteriophage BUCT610. (C) Thermal stability of BUCT610. (D) pH stability of bacteriophage BUCT610. Data are shown as the mean ± SD; **** p < 0.0001, *** p < 0.001, ** p < 0.01, or * p < 0.05 indicates a significant difference between this group and the control (this experiment was repeated in biological triplicate).


