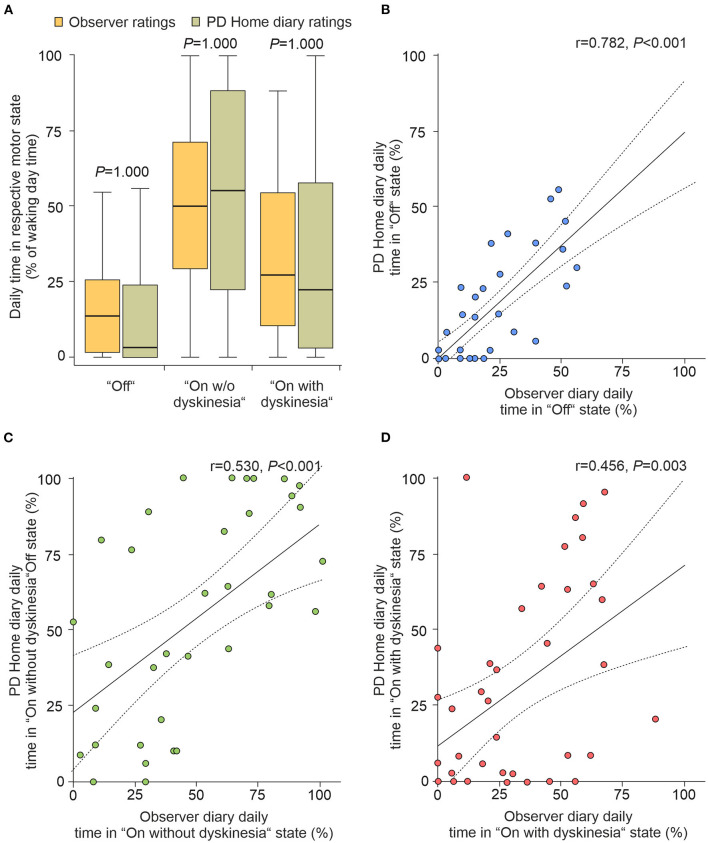
Figure 2.
Proportions for time spent in motor states assessed by observer diaries and PD Home diaries on participant level. (A) Distribution of daily time proportions of “Off”, “On without dyskinesia” and “On with dyskinesia” based on the simultaneous, half-hourly performed diary ratings from 40 participants from two consecutive days (8 am to 4 pm). Boxplots are shown with a central mark at the median, bottom, and top edges of the boxes at 25th and 75th percentiles, respectively, whiskers out to the most extreme points within 1.5 times the interquartile range. Displayed P-values are from Friedmann tests with post-hoc Wilcoxon signed-rank tests with Bonferroni correction for multiple comparisons. (B–D) Correlation analyses of mean proportions of “Off” (B), “On without dyskinesia” (C) and “On with dyskinesia” (D). Solid lines in represent the regression line with 95% CI (dotted lines). Values in upper right corner are the correlation coefficients and P-values from Pearson's correlation tests. PD, Parkinson's disease; CI, confidence interval.

