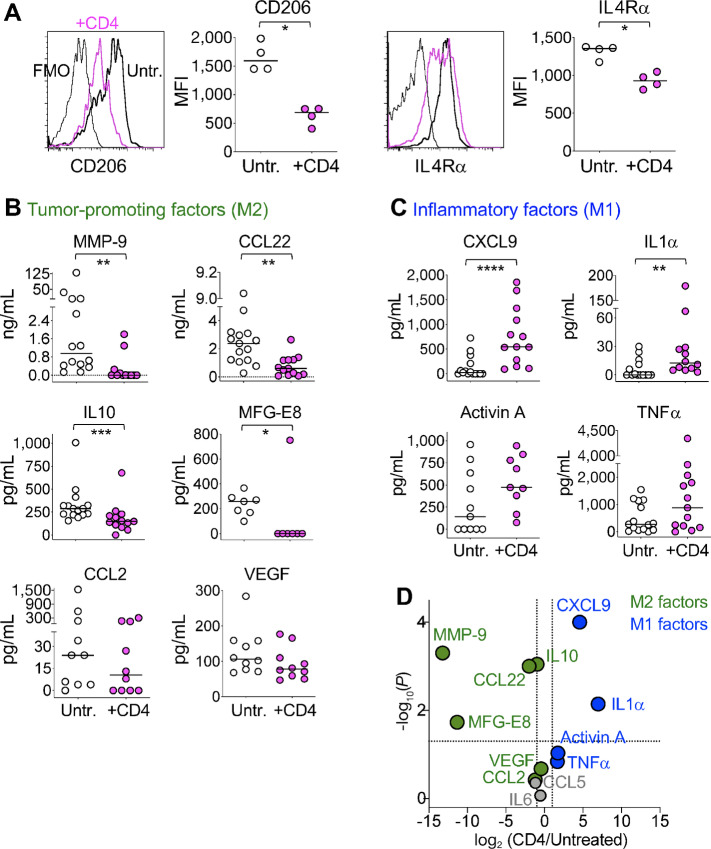
FIGURE 4.
In vivo interactions of tumor-specific CD4 T cells cause a phenotypical and functional switch in the TAMs, from tumor-promoting M2 to inflammatory M1 macrophages. RAGKO mice were challenged with MB49 tumor. Five days later, half of the mice received anti-H-Y specific Marilyn CD4 T cells and 7 days later the TAMs (population I in Fig. 2B) from CD4 treated or untreated mice were compared. A, Representative histograms and mean fluorescent intensity (MFI) of CD206 (left) and IL4Rα (right) expression on TAMs coming from either untreated (white) or CD4-treated (pink) individual mice. Gray line in the histograms is unstained control. Data pooled from two independent experiments. B–D, Sorted TAMs coming from either untreated or CD4-treated mice (white vs. pink circles, respectively) were cultured overnight and tumor-promoting M2 factors (B) and inflammatory M1 factors (C) measured in the supernatants. A–C, Individual circles represent TAMs from individual mice. Horizontal lines are the medians in each experimental group. D, Volcano plot of combined data from B, C, and Supplementary Fig. S5 representing the ratio of the medians of each factor found in TAMS from CD4-treated versus untreated mice. Vertical discontinuous lines show 2-fold differences and horizontal discontinuous line shows P value of 0.05 by two-tailed Mann–Whitney test. Green and blue circles are M2 or M1 macrophage factors, respectively. Gray circles are factors not attributed to either group. B–D, Data compiled from three to nine independent experiments. A–C, *, P < 0.05; **, P < 0.01; ***, P < 0.001 using two-tailed Mann–Whitney test.

