FIGURE 5.
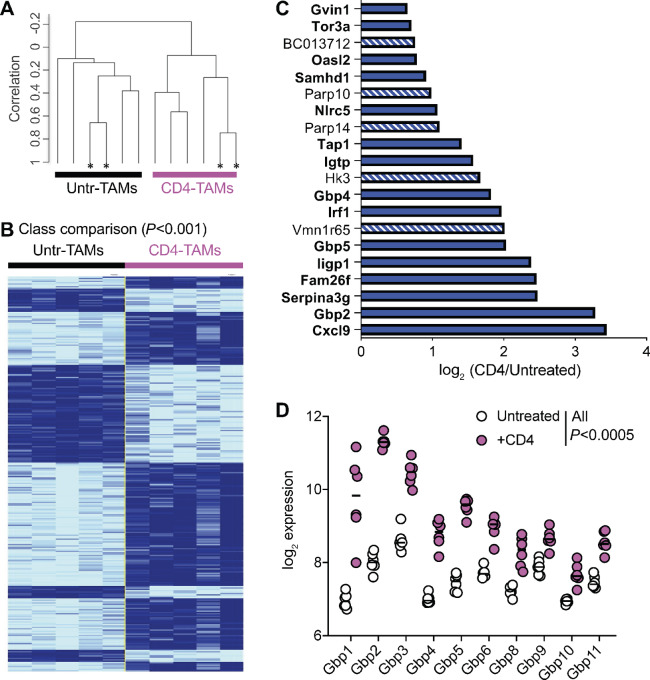
In vivo CD4 education of TAMs is driven by an IFNγ responsive gene signature. Sorted TAMs (population I in Fig. 2B) from either untreated (black) or CD4-treated (pink) mice were compared at the transcriptional level. Each group of TAMs consisted of five samples (four from individual mice and one from pooled mice), obtained in two individual experiments. A, Hierarchical clustering based on 18,893 genes that passed the filtering criteria. *, Technical replicates. B, Class comparison identifying 291 differentially expressed genes between the two groups of TAMs at P < 0.001. Technical duplicates were averaged into one sample. C, log2 of the expression ratio of the 20 genes most significantly differentially expressed (P < 2 × 10⁻⁶) between TAMs coming from CD4-treated versus untreated mice. Genes in bold and solid bars have been described to be downstream of IFNγ signaling. D, log2 expression of the Gbp family of genes in TAMs from CD4-treated or untreated mice, in pink circles and white circles, respectively. All Gbp with P < 0.0005 after Benjamini, Krieger, and Yekutieli correction for multiple comparisons.

