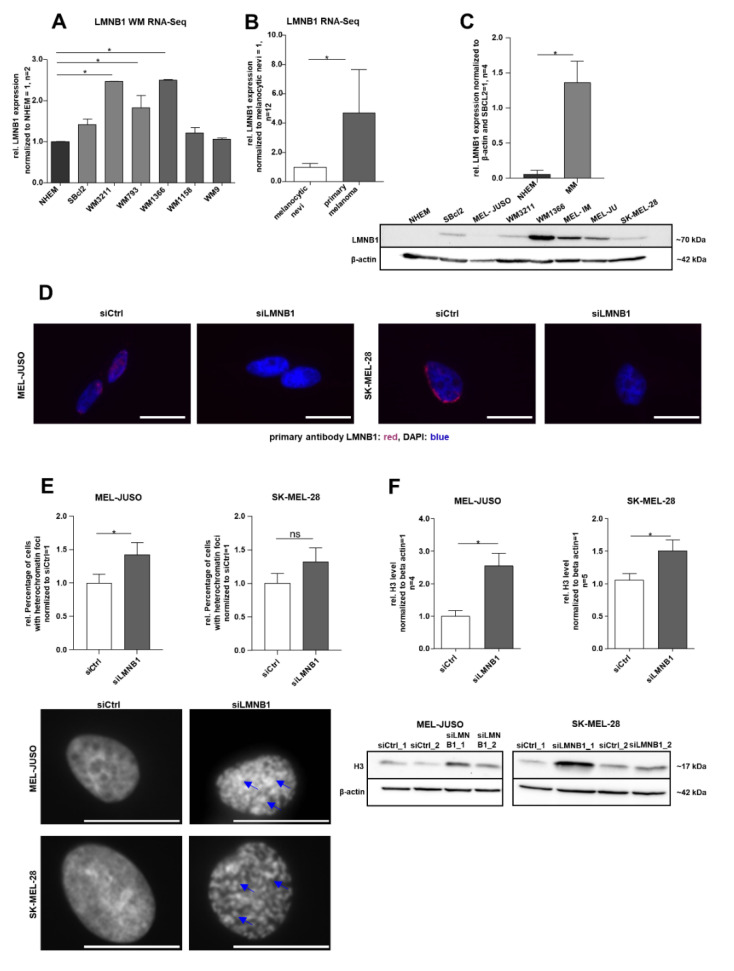
Figure 1.
(A) RNA sequencing analysis of LMNB1 expression in different Wistar melanoma (WM) cell lines compared to NHEMs (one-way ANOVA and subsequent Tukey’s multiple comparison test). (B) RNA sequencing analysis of LMNB1 expression in the primary melanoma compared to melanocytic nevi (one-way ANOVA and subsequent Tukey’s multiple comparison test). (C) Western blot analysis of LMNB1 protein expression in NHEMs and various melanoma cell lines (Student’s t-test). (D) Representative images of immunofluorescence LMNB1 staining in MEL-JUSO and SK-MEL-28 transfected with siLMNB1 and siCtrl for 72 h. Scale bars equal 20 µm. (E) DAPI staining of MEL-JUSO and SK-MEL-28 cells transfected with siLMNB1 and siCtrl for 72 h. Visible heterochromatin foci marked with blue arrows. Statistical analysis was performed using Student’s t-test. Scale bars equal 20 µm. (F) Western blot analysis of the H3 level following 72 h treatment with siLMNB1 and siCtrl in MEL-JUSO and SK-MEL-28 using β-actin as a housekeeper (Student’s t-test). Bars represent the means ± SEM (* = p ≤ 0.05, ns = not significant).

