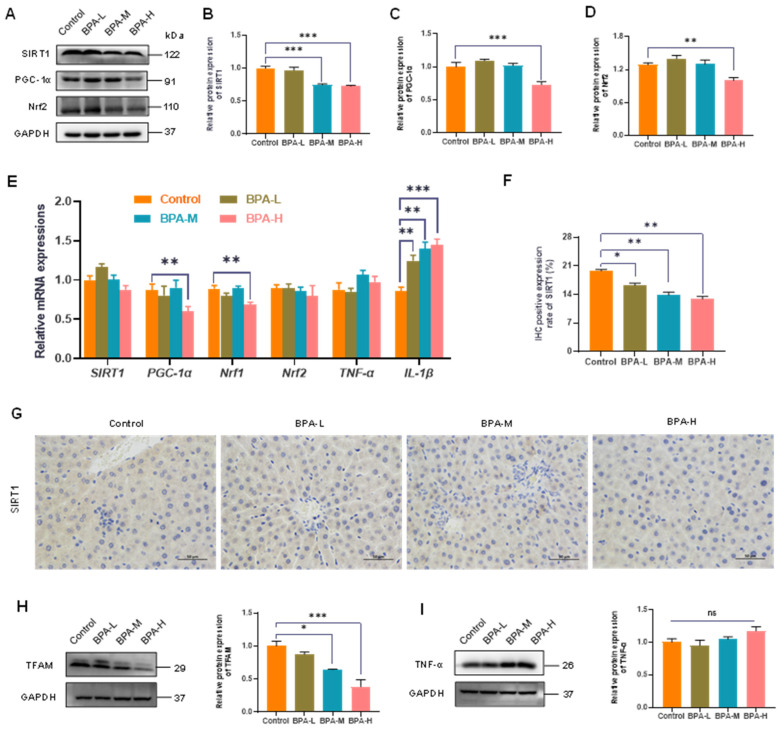
Figure 3.
Effects of BPA on the liver SIRT1/PGC-1α pathway. (A) The relative protein levels of PGC-1α, Nrf2, and SIRT1. (B–D) Values of quantitative analysis (n = 4). (E) Relative mRNA levels of SIRT1, PGC-1α, Nrf1, Nrf2, TNF-α, and IL-1β. (F) Percentage of immunostaining for Sirt1. (G) Immunohistochemistry shows the expression of hepatic SIRT1 (400× magnifications). (H) The relative protein levels of TFAM and (I) the relative protein levels of TNF-α. Data are presented as mean ± SEM. * p < 0.05, ** p < 0.01, *** p < 0.01 vs. control group. ns: no significance.

