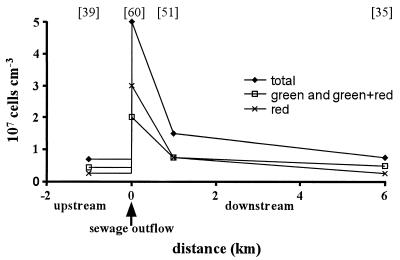
FIG. 5.
Bacteria distribution in the Adda River (Italy) at four different stations: 1 km upstream from a sewage outflow, at the sewage outflow site, and at 1 and 6 km downstream from the sewage outflow point. Bacteria were resolved according to their fluorescence (green and green-plus-red bacteria and red fluorescent bacteria) generated by the NADS protocol. The values in brackets are the percentages of red fluorescent bacteria relative to the total count.

