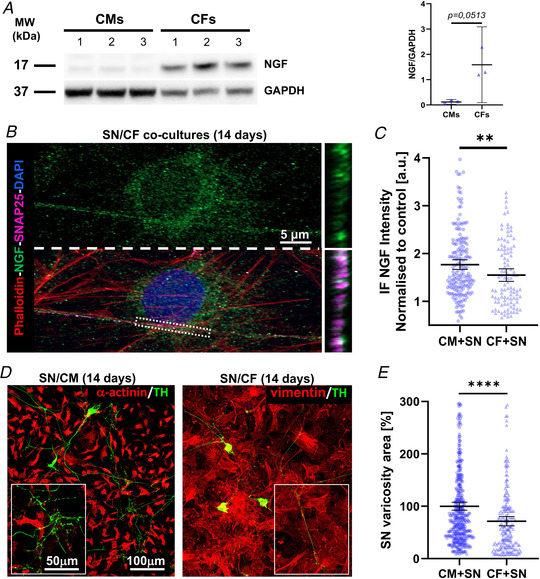
Figure 5. Sympathetic neurons co‐cultured with cardiac fibroblasts require exogenous nerve growth factor.

A , western blotting of nerve growth factor (NGF) protein content on extracts from cardiac fibroblasts (CFs) and cardiomyocytes (CMs), maintained in culture for 14 days, in the absence of exogenous NGF. Actin was used as loading control. The right panel shows the relative densitometry. Data distribution is represented by the individual values. Mean and error bars, representing 95% confidence intervals, are shown. Differences among groups were determined using an unpaired t test. (Three independent experiments were performed). B, confocal immunofluorescence (IF) analysis of 14‐day sympathetic neuron (SN)/CF co‐cultures maintained in the absence of exogenous NGF in the culture medium. Cells were co‐stained with antibodies against SNAP25 and NGF and counterstained with Alexa633‐conjugated phalloidin and DAPI. Bottom panels show resliced images of the boxed area highlighting the intercellular interface. C, quantification of the mean NGF fluorescence intensity in the portion of SN processes contacting CMs (black bars) vs. CFs (grey bars). Data distribution is represented by the individual values. Mean and error bars, representing 95% confidence intervals, are shown. Differences among groups were determined using the Mann–Whitney test. (**, P < 0.01; SN/CM: n = 186 and SN/CF: n = 104 areas analysed/group. Three independent cell preparations were analysed). D, confocal IF analysis of 14‐day SN/CM (left panel) vs. SN/CF (right panel) co‐cultures maintained in the absence of exogenous NGF. Cells were co‐stained with antibodies against tyrosine hydroxylase (TH) and either anti‐α‐actinin (for SN/CM co‐cultures) or anti‐vimentin (for SN/CF co‐cultures). E, quantification of the mean area of neuronal varicosities in contact with either CMs or CFs. To highlight the differences between the two independent populations, values of the area of SN/CF contact sites were normalized to the average area size of varicosities in contact with CM. Mean and error bars, representing 95% confidence intervals, are shown. Differences among groups were determined using the Mann–Whitney test. (** **, P < 0.0001; n = 24 cell couples for each group. Three independent cell preparations were analysed). [Colour figure can be viewed at wileyonlinelibrary.com]
