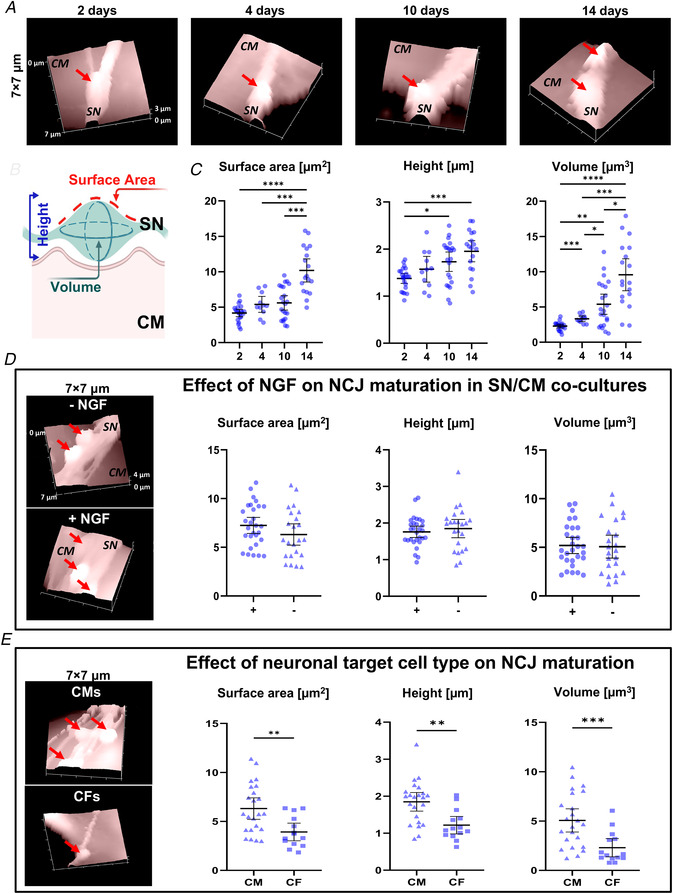
Figure 6. Surface topography of neuronal varicosities during co‐culture maturation.

A , representative topographical images of sympathetic neurons (SNs) in 2‐, 4‐, 10‐ and 14‐day co‐culture with cardiomyocyte (CM). Red arrows indicate neuronal varicosities. B, topographical parameters evaluated on SICM images and (C) relative measurements in SN/CM co‐cultures analysed at different time points. Data distribution is represented by the individual values. Mean and error bars, representing 95% confidence intervals, are shown. Differences among groups were determined using the Brown–Forsythe test, with Dunnett's correction. (*, P < 0.05; **, P < 0.01; ** *, P < 0.001; ** **, P < 0.0001; n = 15 SN/CM contacts for each group). D, representative SICM surface scans and quantification of relative parameters of the contact sites in 10‐day SN‐CM co‐cultures, maintained in the absence (‐) or the presence (+) of exogenous nerve growth factor (NGF). Data distribution is represented by the individual values. Mean and error bars, representing 95% confidence intervals, are shown. Differences among groups were determined using an unpaired t test. (P = ns; n = 23 SN/CM contacts for each group). E, representative SICM surface scans and quantification of relative parameters of the contact sites in 10‐day SN/CF co‐cultures, maintained in the absence of exogenous NGF. Data distribution is represented by the individual values. Mean and error bars, representing 95% confidence intervals, are shown. Differences among groups were determined using an unpaired t test or Mann–Whitney test. (**, P < 0.01; ** *, P < 0.001; SN/CM: n = 23 and SN/CF: n = 14 contacts). [Colour figure can be viewed at wileyonlinelibrary.com]
