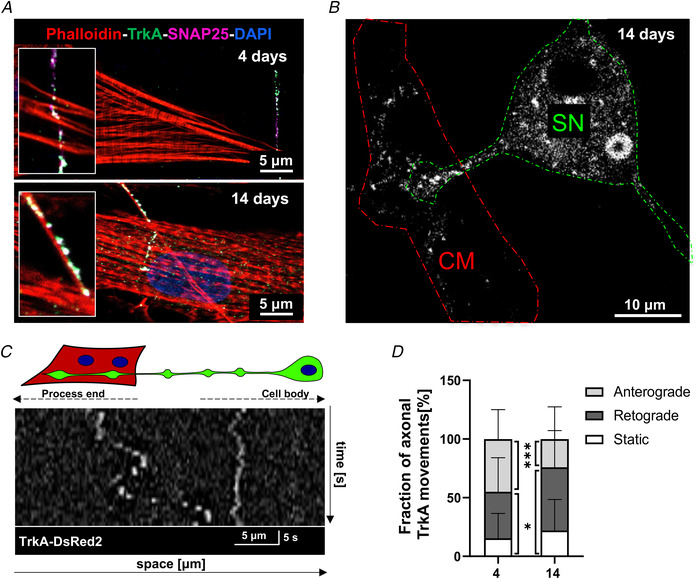
Figure 8. TrkA signalling assay in sympathetic neurons during time in co‐culture.

A , confocal immunofluorescence (IF) analysis of 4‐day (top panel) vs. 14‐day (bottom panel) co‐cultures co‐stained with antibodies against TrkA and SNAP25. Cells were co‐stained with Alexa633‐conjugated phalloidin. Nuclei were counterstained with DAPI. B, confocal IF of sympathetic neuron (SN)/cardiomyocyte (CM) co‐culture infected with an adenoviral vector encoding TrkA‐DsRed2. The dashed lines indicate SN (green) and innervated CM (red). C, representative kymograph of TrkA‐DsRed2 dots in one neuronal process of a 4‐day SN/CM co‐culture. D, quantification of TrkA‐DsRed2 trafficking in SN processes contacting CMs, in early (4 days) and mature (14 days) co‐cultures. Values are indicated as means ± SD. Differences among groups were determined using the Mann–Whitney test. (*, P < 0.05; ** *, P < 0.001; (4 days): n = 47 and (14 days): n = 40 cells per group. Three independent cell preparations were analysed). [Colour figure can be viewed at wileyonlinelibrary.com]
