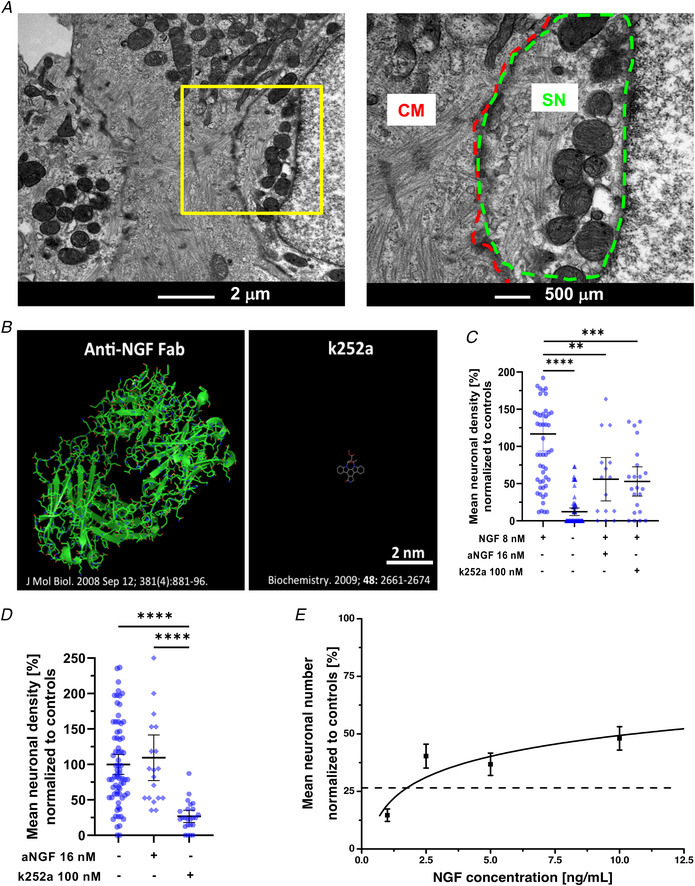
Figure 9. Pharmacological assay of cardiomyocyte‐neuron nerve growth factor signalling at the neuro‐cardiac junction.

A , transmission electron microscopy of 14‐day sympathetic neuron (SN)/cardiomyocyte (CM) co‐cultures. The right panel is the magnification of the area in the left yellow inset. B, Jmoll 3D reconstruction of the Fab domain of an anti‐nerve growth factor (NGF) IgG and of k252a. C, quantification of the mean neuronal density upon treatment of SN cultures with either anti‐NGF or k252a. Data distribution is represented by the individual values. Mean and error bars, representing 95% confidence intervals, are shown. Differences among groups were determined using the Mann–Whitney test. (**, P < 0.01; ** *, P < 0.001; ** **, P < 0.0001; n = 35 fields/condition from three independent cell preparations). D, quantification of the mean neuronal density in SN/CM co‐cultures treated as in (C). Data distribution is represented by the individual values. Mean and error bars, representing 95% confidence intervals, are shown. Differences among groups were determined using the Kruskal–Wallis test. (** **, P < 0.0001; n = 35 fields/condition from three independent cell preparations). E, dose/effect curve of NGF on neuronal density in SN cultures treated with 100 n m k252a. Interpolation was calculated using non‐linear regression obtained with Microsoft Excel. Fitting line is shown (solid black). The dashed line indicates neuronal density in k252a‐treated SN/CM co‐cultures. Bars indicate SD. (n = 24 fields per conditions from three independent cell preparations). [Colour figure can be viewed at wileyonlinelibrary.com]
