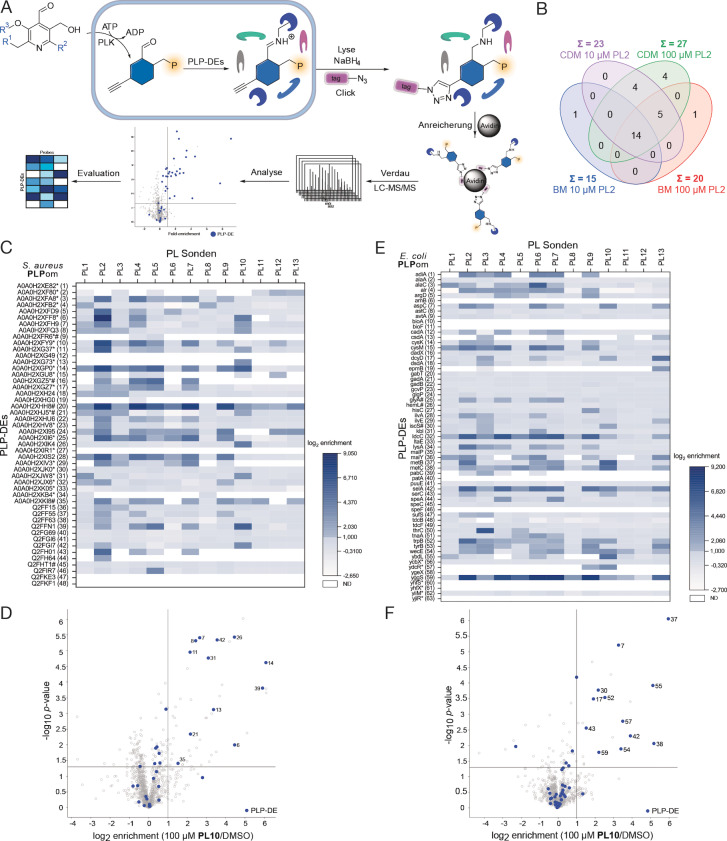
Figure 2.
S. aureus and E. coli PLPome profiling. A) PL probes are taken up by the cells, get phosphorylated by PLK and subsequently function as PLP surrogates. After cell lysis, internal aldimines are reduced by sodium borohydride for downstream processing. Copper‐assisted azide‐alkyne click chemistry or Staudinger ligation to enrichment tags allows proteomic analysis and PLPome profiling. B) Comparison of enriched PLP‐DEs in S. aureus using different media (B medium, BM or chemically defined medium, CDM) and different PL2 concentrations (10 and 100 μM). C) Heatmap representing log2 enrichment values of all known or putative PLP‐DEs in S. aureus for all 13 PL probes (n=3). Enriched proteins have log2 enrichment values higher or equal 1. Proteins not detected (ND) at all are coloured white. PLP‐DEs with a putative function or which are poorly characterised are marked with an asterisk. Essential enzymes are marked with a #. [26] D) Volcano plot of PL10 enrichment at 100 μM in S. aureus USA300 TnpdxS compared to DMSO representing the t‐test results (criteria: log2 enrichment>1 and p‐value<0.05, n=3). Blue colours depict PLP‐DEs. Assigned numbers refer to Table SI1. Remaining plots are shown in Figure SI4. E) Heatmap representing log2 enrichment values of all known or putative PLP‐DEs in E. coli for all 13 PL probes (n=3). Enriched proteins have log2 enrichment values higher or equal 1. Proteins not detected (ND) at all are coloured white. PLP‐DEs with a putative function or which are poorly characterised are marked with an asterisk. Essential enzymes are marked with a #. [28] F) Volcano plot of PL10 enrichment at 100 μM in E. coli K12 ΔpdxJ compared to DMSO representing the t‐test results (criteria: log2 enrichment>1 and p‐value<0.05, n=3). Blue colours depict PLP‐DEs. Assigned numbers refer to Table SI2. Remaining plots are shown in Figure SI6.

