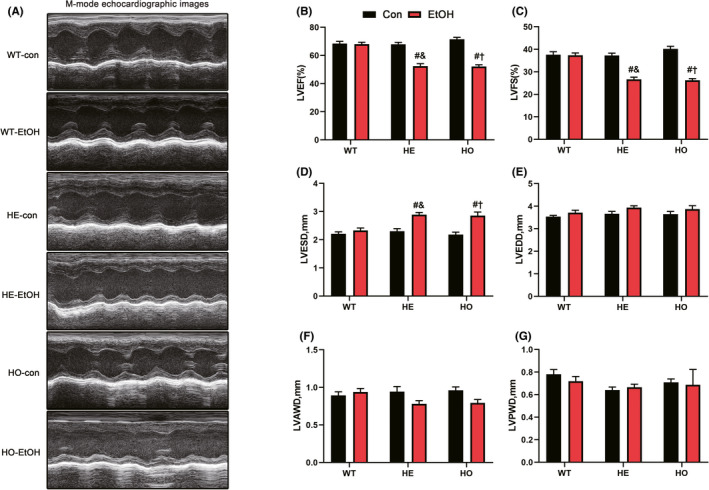
FIGURE 2.

Cardiac function of WT, HE, and HO mice with or without moderate alcohol challenge. (A) Representative M‐mode echocardiographic images of each study group. (B) left ventricular ejection fraction (LVEF). n = 15. (C) Left ventricular fractional shortening (LVFS). n = 15. (D) Left ventricular end‐systolic dimension (LVESD). n = 15. (E) Left ventricular end‐diastolic dimension (LVEDD). n = 15. (F) Left ventricular anterior wall thickness in diastole (LVAWD). n = 15. (G) Left ventricular posterior wall thickness in diastole (LVPWD). n = 15. All measurements were based on similar anesthesia conditions. The data are presented as the mean ± SEM. Statistical comparisons were carried out by one‐way ANOVA. The data are presented as the mean ± SEM. Statistical comparisons were carried out by one‐way ANOVA. *p < 0.05, versus WT‐con, # p < 0.05, versus WT‐EtOH, & p < 0.05, versus HE‐con, $ p < 0.05, versus HE‐EtOH, † p < 0.05, versus HO‐con
