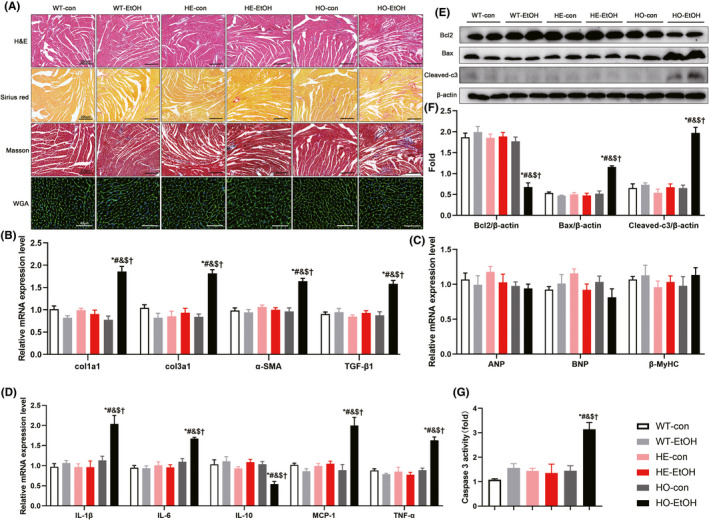
FIGURE 4.

Myocardial fibrosis, cross‐sectional areas, inflammation, and apoptosis in WT, HE, and HO mice with or without moderate alcohol drinking. The data indicated that after 6 weeks of moderate alcohol treatment, there were no differences in cross‐sectional areas among six groups. There were also no significant differences in myocardial fibrosis, inflammation, and apoptosis in HE‐EtOH mice compared to WT‐EtOH mice after 6 weeks of moderate alcohol challenge. (A) Representative images of hematoxylin and eosin (H&E) staining of the entire heart in transverse midsection showing the heart structural deficits (images in the first row, Scale bars = 200 μm); representative images of Sirius red staining (images in the second row, Scale bars = 200 μm) and Masson's trichrome staining (images in the third row, Scale bars = 200 μm) showing the collagen deposition in heart tissues of mice; representative images of wheat germ agglutinin (WGA)‐fluorescein isothiocyanate staining of heart tissues showing cardiomyocytes hypertrophy (images in the fourth row, Scale bars = 40 μm). (B) mRNA expression levels of pro‐fibrosis genes col1a1, col3a1, α‐SMA, and TGF‐β1 in mouse hearts. n = 8. (C) mRNA expression levels of pro‐hypertrophic genes ANP, BNP, β‐MyHC in the hearts of mice. n = 8. (D) mRNA expression levels of inflammatory cytokines IL‐1β, IL‐6, IL‐10, MCP‐1, and TNFα levels in the hearts of mice. n = 8. (E) Representative western blots of apoptosis‐related Bcl2 (26 KDa), Bax (21 KDa), and cleaved caspase 3 (Cleaved‐c3) (17 KDa) with β‐actin (43 KDa) used as loading control in mouse heart tissues; (F) densitometry values (normalized to β‐actin) of Bcl2, Bax, and Cleaved‐c3. n = 6. (G) myocardial apoptosis was measured using Caspase‐3 activity. n = 4. The data are presented as the mean ± SEM. Statistical comparisons were carried out by one‐way ANOVA. *p < 0.05, versus WT‐con, # p < 0.05, versus WT‐EtOH, & p < 0.05, versus HE‐con, $ p < 0.05, versus HE‐EtOH, † p < 0.05, versus HO‐con
