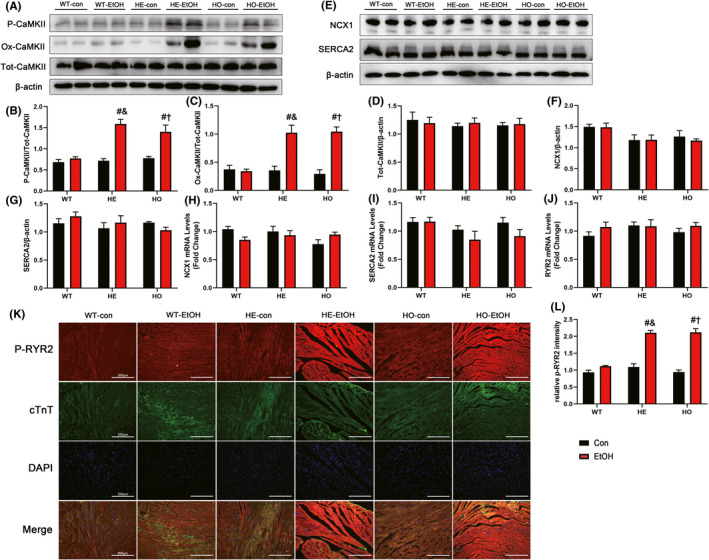
FIGURE 7.

Ca2+‐related protein markers in WT, HE, and HO mice with or without moderate alcohol treatment. (A) Representative western blots of P‐CaMKII (phosphorylated‐Thr286 CaMKII) (60 KDa), Ox‐CaMKII (oxidized CaMKII) (55 KDa), and Tot‐CaMKII (total CaMKII) (54 KDa) with β‐actin (43 KDa) used as loading control in mouse heart tissues; densitometry values (normalized to β‐actin) of (B) P‐CaMKII, (C) Ox‐CaMKII, and (D) Tot‐CaMKII. n = 6. (E) Representative western blots of NCX1 (120 KDa) and SERCA2 (115 KDa) with β‐actin (43 KDa) used as loading control in mouse heart tissues; densitometry values (normalized to β‐actin) of (F) NCX1 and (G) SERCA2. n = 6. RT‐qPCR analysis of (H) NCX1, (I) SERCA2, and (J) RYR2 (ryanodine receptor type 2) gene in mouse heart. n = 8. (K) Immunofluorescence staining images of P‐RYR2 (phosphorylated‐S2814 RYR2) in mouse heart (Scale bars = 200 μm). (L) Quantification of P‐RYR2 immunofluorescence staining from different visual fields of six samples in each experimental group. n = 6. The data are presented as the mean ± SEM. Statistical comparisons were carried out by one‐way ANOVA. *p < 0.05, versus WT‐con, # p < 0.05, versus WT‐EtOH, & p < 0.05, versus HE‐con, $ p < 0.05, versus HE‐EtOH, † p < 0.05, versus HO‐con
