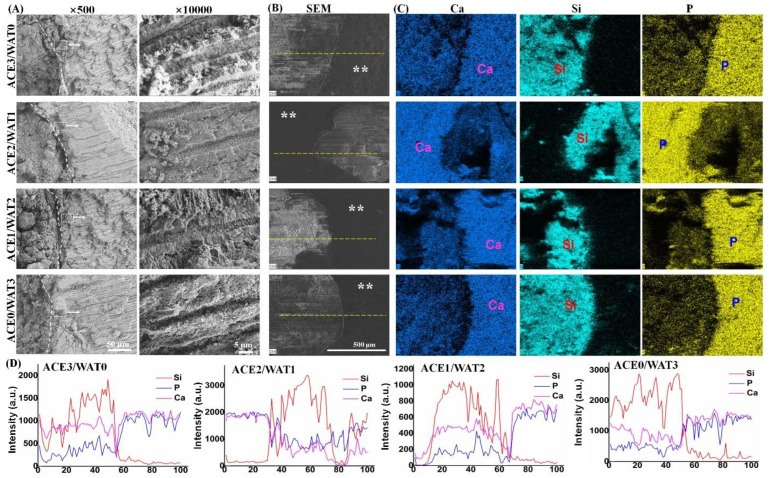
Figure 6.
SEM-EDX analysis of the interface of filler/root canal system after soaking in saliva for 120 h. (A) SEM mages of the cross-sectional microstructures; (B) low-magnification SEM images of fracture surface area between the root canal and cement; (C) face-scanning EDX mapping; (D) line-scanning EDS profiles along the interfaces zone as shown in (B). Dotted-line in (A) shows the interface between the apex root of a tooth filled with the C2Si/ATT2 cements. ** dentine; dotted line representing the interface between dentine and paste cement.

