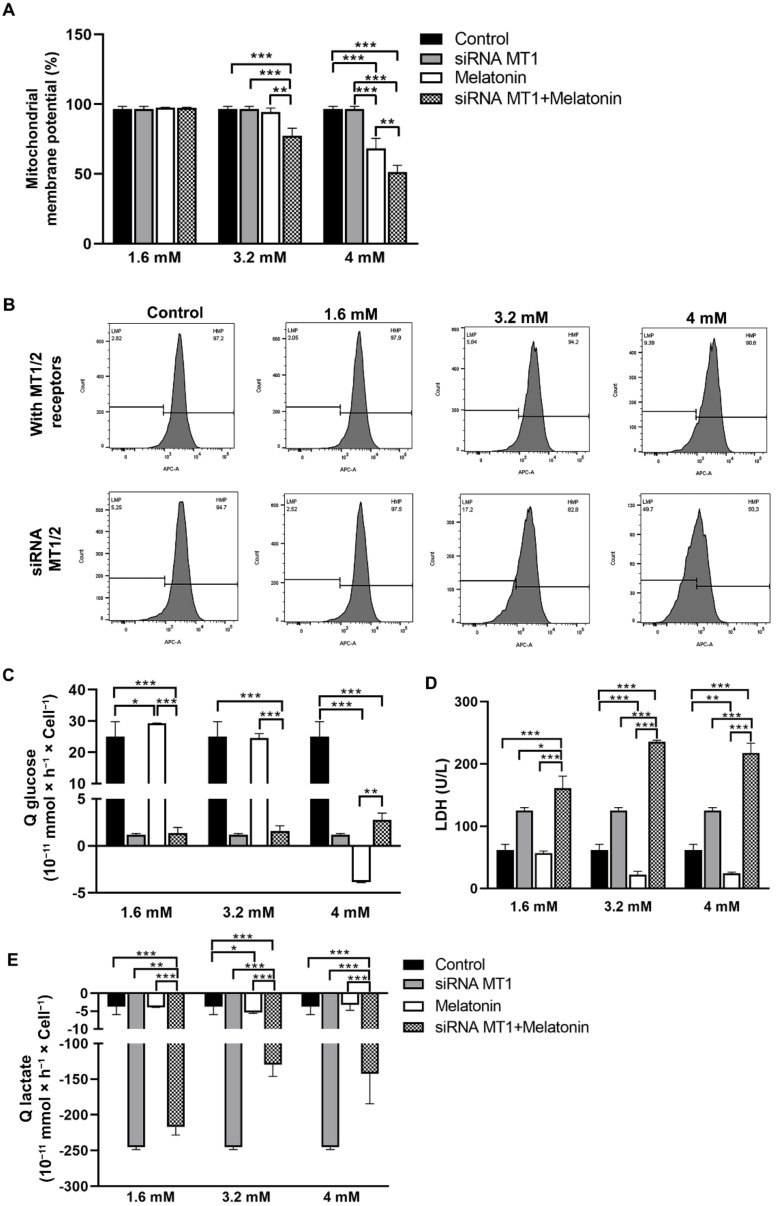
Figure 3.
Melatonin alters mitochondrial integrity and reduces the Warburg effect in SKOV-3 cells. (A) Mitochondrial membrane potential rate in SKOV-3 cells, in the presence or absence of MT1, after melatonin treatment for 48 h. MitoStatus Red was used to detect cells by flow cytometry. (B) Representative analysis of mitochondrial membrane potential in SKOV-3 cells. (C) Glucose consumption. (D) LDH activity. (E) Lactate consumption in SKOV-3 cells after melatonin treatment, in the presence or absence of MT1. The analysis was made using different experimental conditions and the respective control groups. Data are expressed as the mean ± SD. * p < 0.05, ** p < 0.01, *** p < 0.001.

