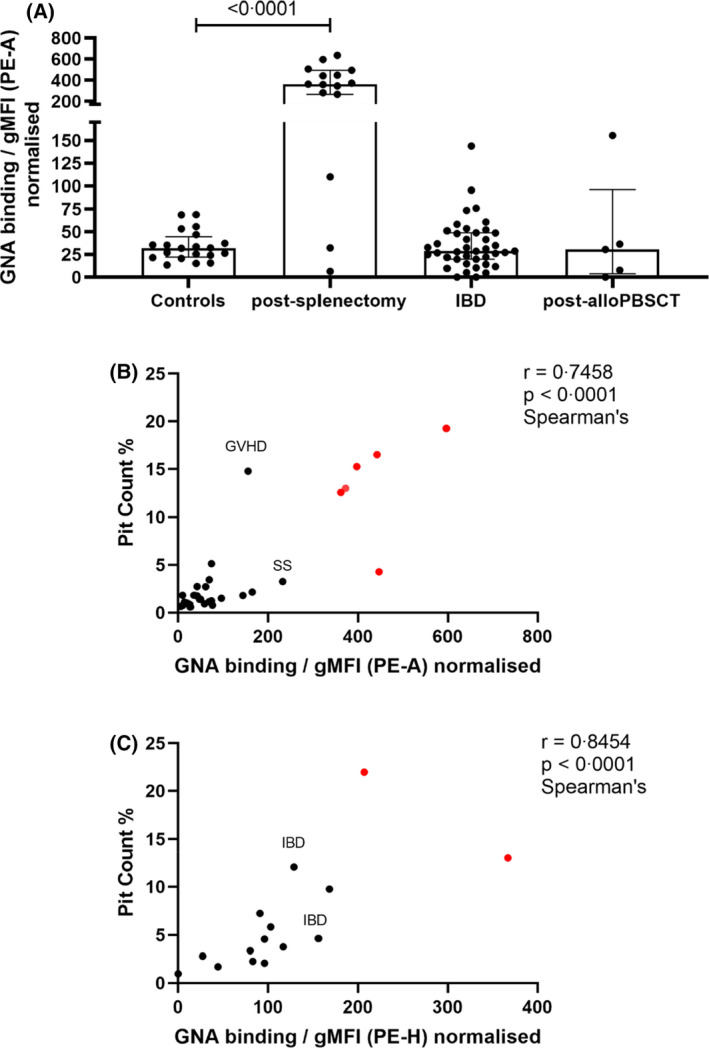
FIGURE 3.

RBC HMG levels as a potential test of splenic function. (A) RBC HMG levels from healthy controls (n = 20), patients after splenectomy (n = 15) and patients with potential functional hyposplenism: inflammatory bowel disease (IBD) [Crohn's disease (n = 15), ulcerative colitis (n = 3), not further specified (n = 22)] and post‐allogeneic peripheral blood stem cell transplantation (post‐alloPBSCT; n = 5). Medians with interquartile ranges are shown; p value calculated using the Mann–Whitney test. (B) Correlation between pit counts and HMG levels measured by gMFI‐area under curve of GNA binding. Samples from post‐splenectomy donors shown in red, sample from donor with sickle cell disease marked SS and from patient with graft‐versus‐host disease (GVHD) (total n = 31). (C) Correlation between pit counts and HMG levels measured by gMFI‐peak height of GNA binding, measured using samples obtained independently of those used to measure area under curve in (B). Samples from post‐splenectomy donors shown in red, patients with inflammatory bowel disease marked IBD (total n = 15). gMFI, geometric mean fluorescence intensity; GNA, Galanthus nivalis agglutinin; HMG, high‐mannose glycan; PE‐A, area under curve of phycoerythrin staining; RBC, red blood cell
