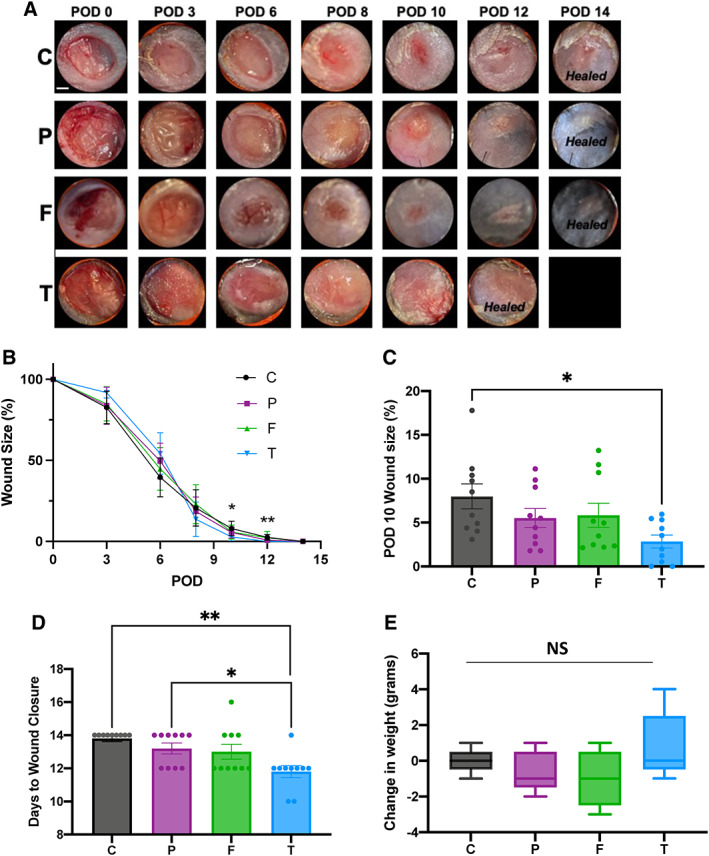
FIGURE 2.

(A) Representative images of the wound are over time by treatment group, where C = Control; P = Promogran™; F = Fibracol® Plus; T = TauTona Wound Dressing. POD, postoperative day. Healed = healed wound that has closed. (B) Quantification of wound area over time by treatment group. (C) Wound area size at POD10 (n = 10/group). (D) Days until complete wound closure by treatment group (n = 10/group). (E) Change in mouse weight from pre‐op (Day 0) to study completion (Day 14) (n = 5/group). Scale bar: 1 mm. Statistical analysis was performed using analysis of variance (ANOVA) with Tukey's multiple comparisons test
