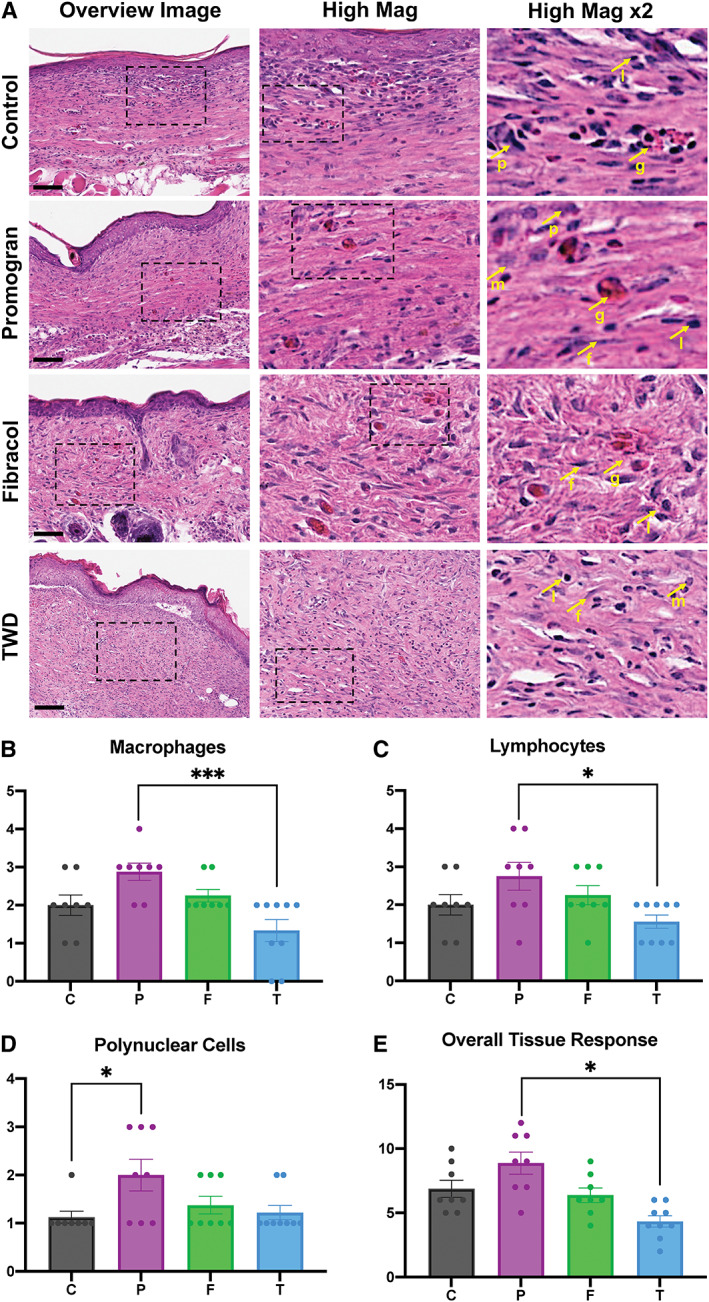
FIGURE 5.

(A) Representative H&E images of healed murine excisional wounds showing cells (nuclei in purple) and extracellular matrix (pink) in all groups. Box indicates area chosen for higher magnification images. Arrows indicate; p = polymorphonuclear cells; m = macrophages; l = lymphocytes; f = fibroblasts (indicative of fibrosis); g = giant cells. C = Control Wounds; P = Promogran™‐treated wounds; F = Fibracol® Plus; T = TauTona Wound Dressing. Scale bars: 150 μm. Each image was semi‐quantitatively analysed with histopathology to determine the presence of (B) macrophages, (C) lymphocytes, (D) polynuclear cells, and (E) overall tissue response. n = 10 for all groups. Statistical analysis was performed using analysis of variance (ANOVA) with Tukey's multiple comparisons test
