
Figure 5.
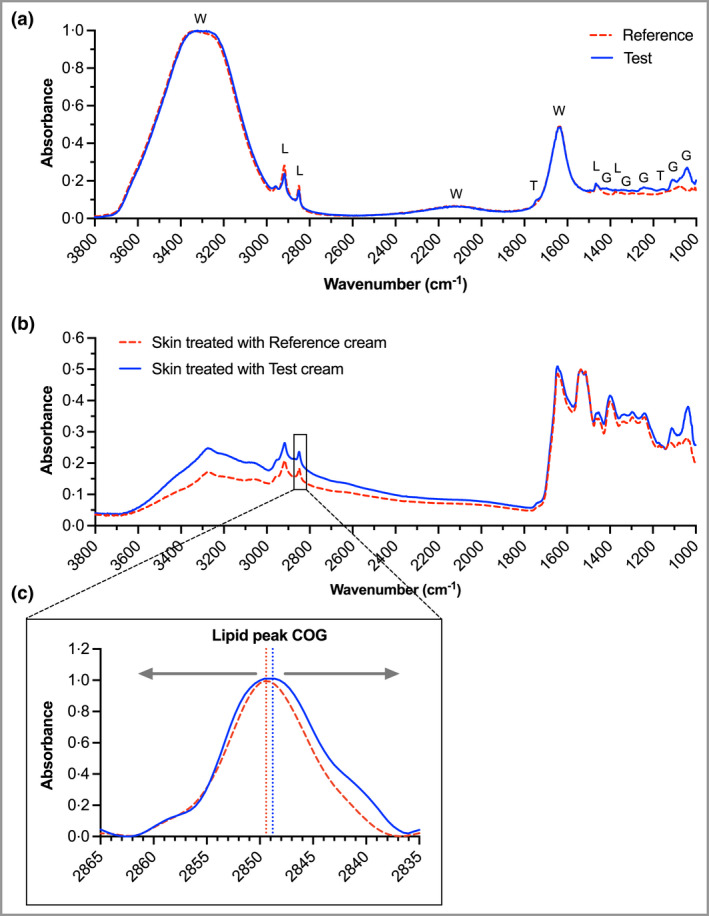
Average Fourier‐transform infrared spectrum of (a) the test products and (b) the skin sites post‐treatment (after five tape strips and normalized to the amide II peak at ~1550 cm−1). The letters indicate the peaks associated with water (W), lipids (L), triglycerides (T) and glycerol (G). (c) Focus on the lipid peak at ~2850 cm−1 following baseline correction. The centre of gravity (COG) of this peak is associated with stratum corneum lipid. [Colour figure can be viewed at wileyonlinelibrary.com]