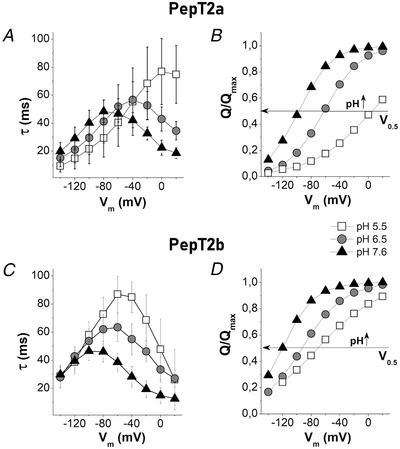
Figure 10. The time constant of decay (τ) and normalized displaced charge (Q/Q max) for Atlantic salmon PepT2 transporters.

PepT2a in A and B and PepT2b in C and D. τ/V in A and C and (Q/Q max)/V in B and D. The sample sizes for τ/V and Q/V for each condition were between 14 and 22 oocytes, from 2–3 batches. The τ/V values are the means (SD). The Q/V values are the means normalized against the maximal moveable charge Q max values obtained by fitting using eqn (3). The unitary charge level was set to the saturation value at positive potential. In B and D, the horizontal arrow intersects each curve at half completion of charge movement corresponding to V 0.5 given by the Boltzmann eqn (3).
