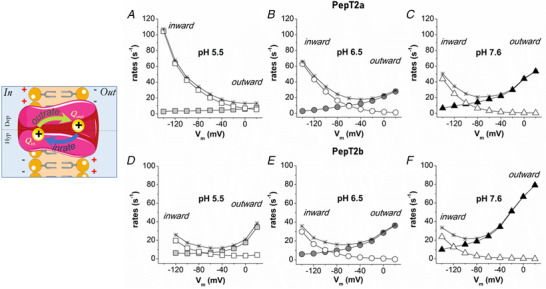
Figure 11. The unidirectional rate constants.

Graphical representation of a two‐state system (left). Inward (open symbols) and outward (solid symbols) rate constants of the intramembrane charge movement of Atlantic salmon PepT2 transporters, PepT2a in A, B and C, and PepT2b in D, E and F. The unidirectional rates, plotted as a function of membrane potentials, were calculated from τ/V (and (Q/Q max)/V (in Fig. 10) at the different pH. The rate (1/τ) of the two transporters are plotted as stars. [Colour figure can be viewed at wileyonlinelibrary.com]
