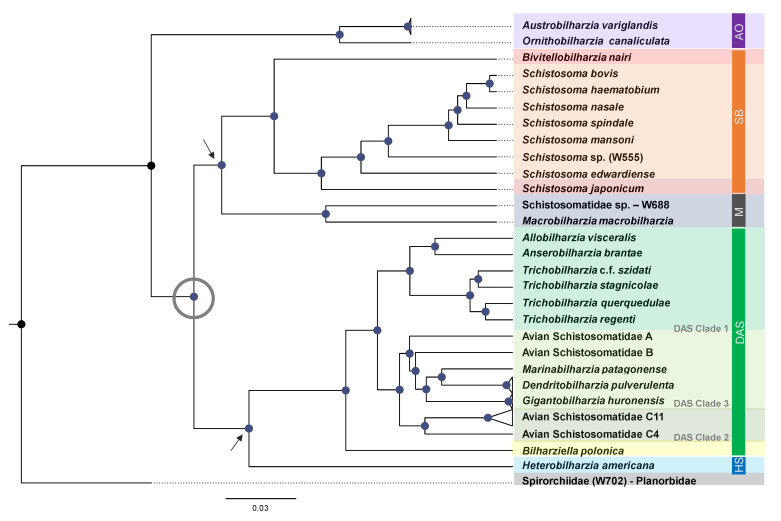
Figure 2.
Bayesian inference analysis preformed in BEAST 2 of 85 concatenated Z-chromosome (UCE) loci. Blue node circles indicate posterior probability values of 1, black circles indicate 0.99. Maximum likelihood (RAxML) analysis provided concordant support values with the following exceptions: bootstrap support for (SB + M) = 66%; ((SB + M) (HS + DAS)) = 93%; (Trichobilharzia c.f. szidati + T. stagnicolae) = 95%. SB = Schistosoma + Bivitellobilharzia; M = Macrobilharzia + Schistosomatidae sp. W688; HS = Heterobilharzia + Schistosomatium; DAS = Anserobilharzia, Allobilharzia, Trichobilharzia, Dendritobilharzia, Gigantobilharzia, Bilharziella and all sampled Avian Schistosomatidae sp. Tree was edited in Fig Tree v 1.4. The gray open circle denotes the major divergence of the derived schistosomatids. The two gray arrows denote the two major derived nodes leading to two simultaneous and independent radiations, one predominantly in birds, the other predominantly in mammals.

